[TiDB Usage Environment] Production Environment
[TiDB Version] 6.5.4
[Reproduction Path] What operations were performed to cause the issue
[Encountered Issue: Issue Phenomenon and Impact]
[Resource Configuration] Enter TiDB Dashboard - Cluster Info - Hosts and take a screenshot of this page
[Attachments: Screenshots/Logs/Monitoring]
At 12:30, it was found on the dashboard that there were 4 TiKV nodes (labeled) on 2 machines, showing (disconnected) and sometimes up status.
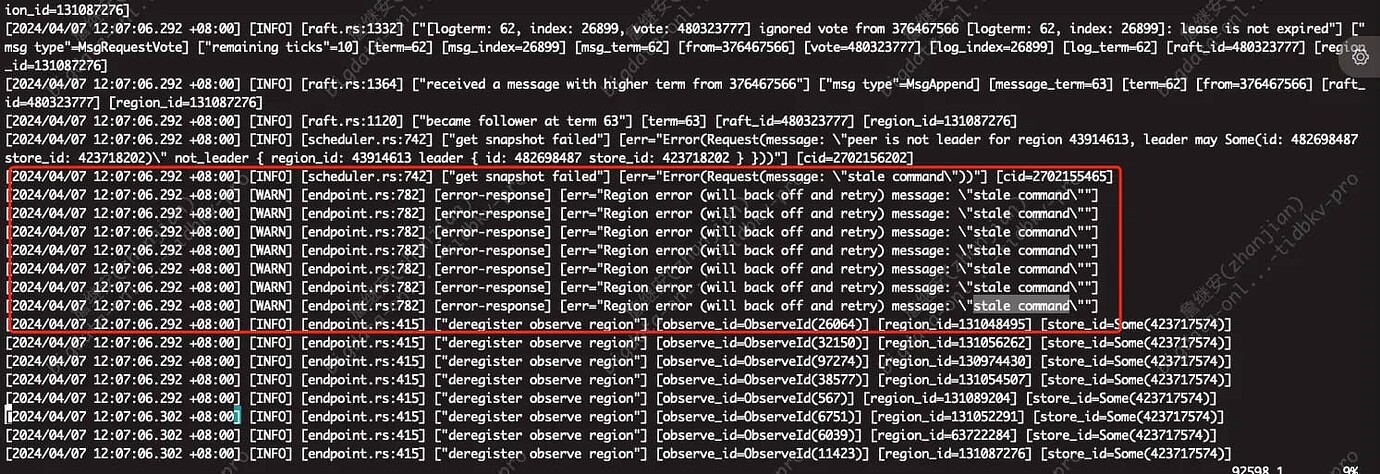
During this period, some SQL queries reported region unavailable errors, and then it was found that the cluster became unwritable from 12:06.
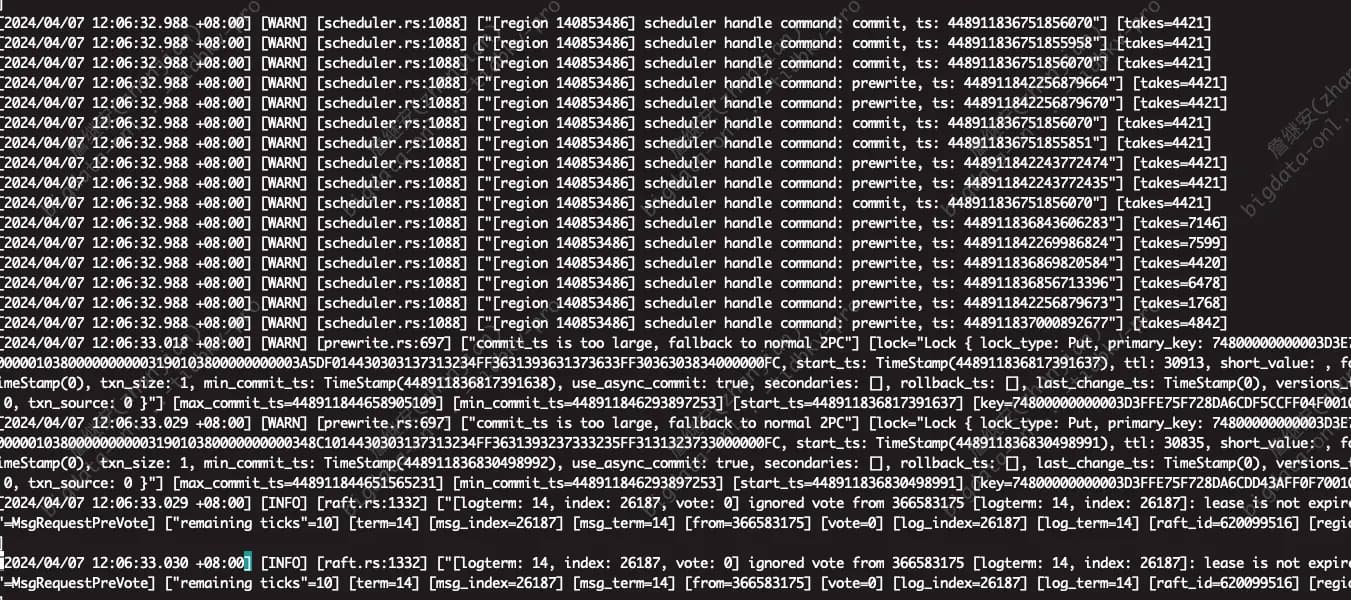
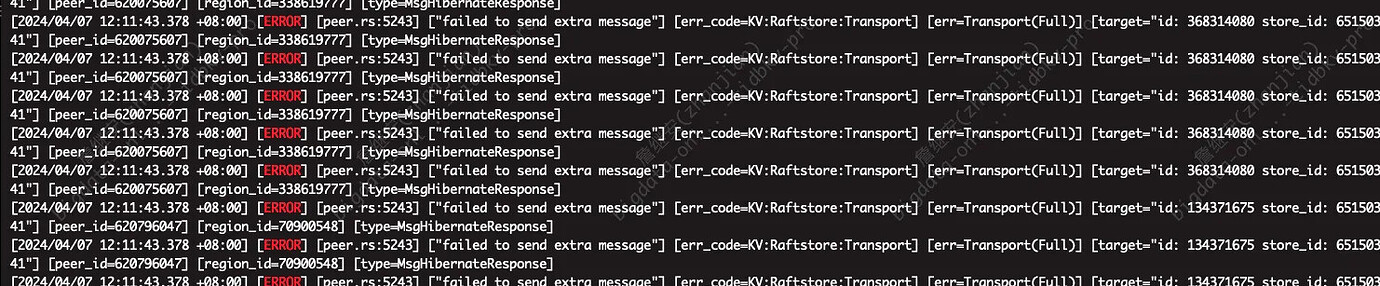
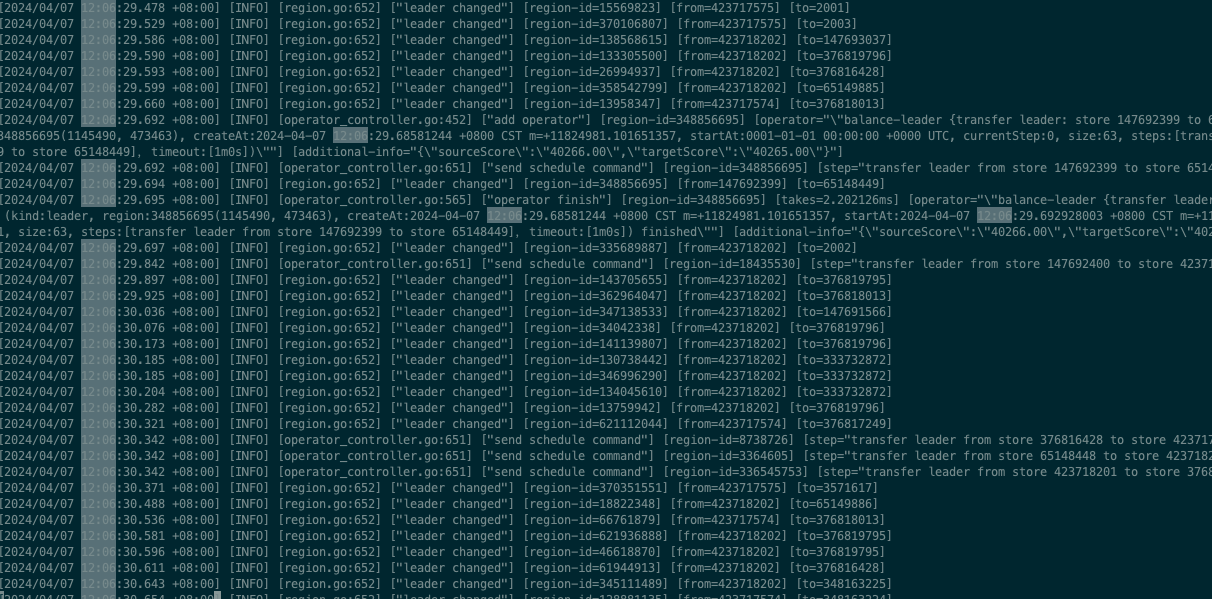
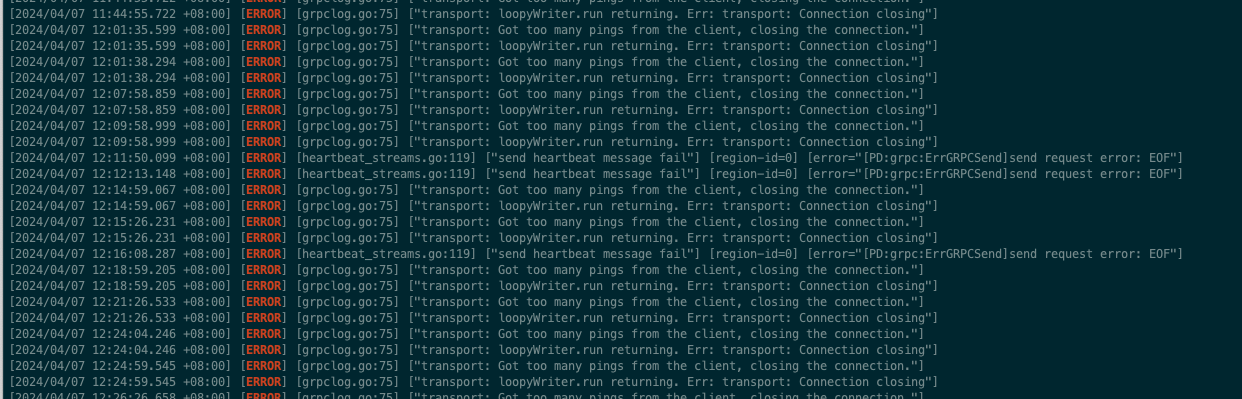
Checked the logs at 12:06 and found a batch of warning logs, but no other special logs.
This is a bit strange. The CPU usage has decreased, so there shouldn’t be a resource shortage. I noticed in the logs that some regions don’t have a leader. Let’s wait for the experts to analyze it.
You can find one of the KV nodes
[2024/04/07 13:14:40.820 +08:00] [INFO] [lib.rs:85] [“Welcome to TiKV”]
[2024/04/07 14:01:56.828 +08:00] [INFO] [lib.rs:85] [“Welcome to TiKV”]
But the first time should be a command restart, and the second time is a server restart.
It seems that at 12:50, the memory usage rose and then rapidly dropped, which looks like a node went down or some other service crashed. However, I don’t understand why this monitoring couldn’t collect the memory usage of one of the servers after 13:00.
Another thing I’m not sure about is why there’s no memory. It might be related to manually starting the server on machine 05, causing some ECS monitoring not to start automatically.
Here are the corresponding logs for machine 06:
[2024/04/07 12:51:50.149 +08:00] [INFO] [lib.rs:85] [“Welcome to TiKV”]
[2024/04/07 12:56:24.206 +08:00] [INFO] [lib.rs:85] [“Welcome to TiKV”]
[2024/04/07 13:53:06.783 +08:00] [INFO] [lib.rs:85] [“Welcome to TiKV”]
Today, my test environment was extremely slow. To get straight to the point, TiDB and PD are deployed in a mixed manner with 3 nodes each. They are all cloud hosts, and one of the nodes had its configuration downgraded by a colleague. It was previously 16GB and was reduced to 8GB. This node was scaled down for TiDB, leaving only PD. Then the lag and slowness disappeared. It doesn’t seem likely, but that’s the actual situation. Could it be that the difference in configuration of the machines running the same services is causing this?