Note:
This topic has been translated from a Chinese forum by GPT and might contain errors.
Original topic: tidb 查询 Limit 10 为啥用时1分30秒?
The table data volume is: 600 million, Limit 10, why is it so slow?
Just checked another limit 1; it took 2 minutes and 30 seconds. The entire cluster jittered.
Execution plan:
explain analyze:
Post the complete execution plan for us to review.
Put it at the very bottom.
Looking at this execution plan, it doesn’t seem right. Check the dashboard to see where the detailed time consumption is.
Try using EXPLAIN ANALYZE + SQL to get the actual execution plan and see where the slowness is. For now, looking at the operator structure of the execution plan, it seems fine to me.
I have encountered this problem as well.
Try using trace format='row' select * from table limit 10; to check. I remember that the total time for loadRegion is quite long during the first query.
However, loadRegion is generally not very slow. This usually happens when the data volume of the entire cluster is huge, and in the past, it was generally left unresolved.
This time, I’m waiting for an answer.
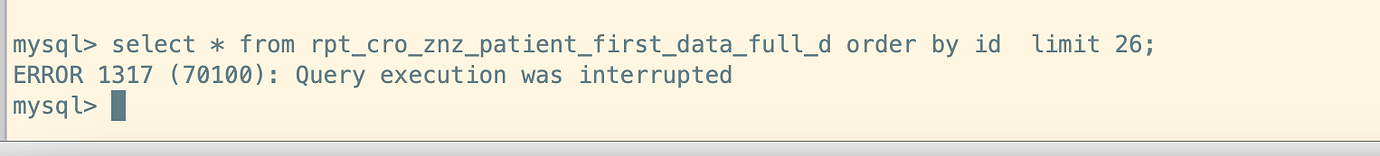
Don’t use limit 10 directly, try using order by id limit 10;
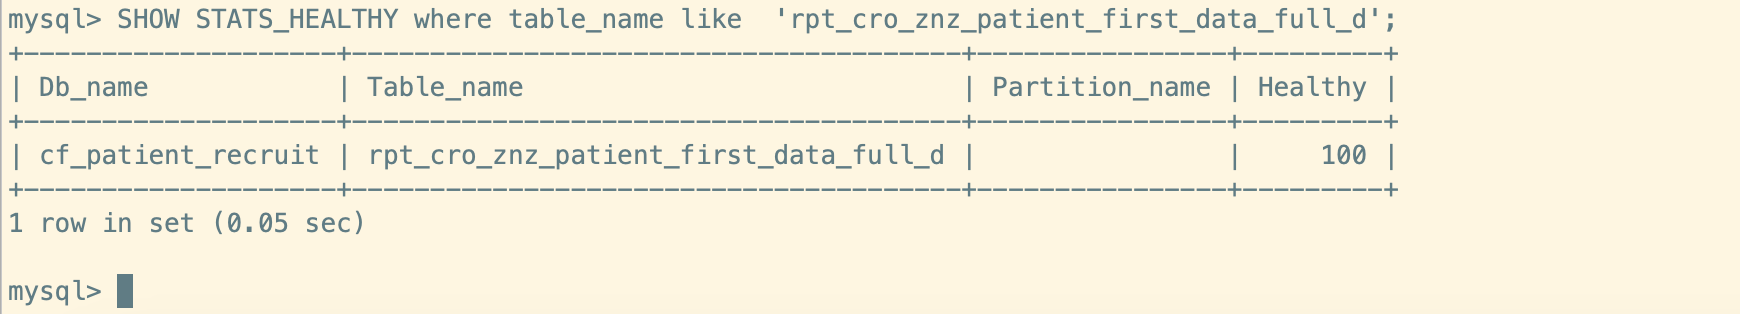
Also, there seems to be an issue with the table statistics.
Check the statistics health.
SHOW stats_healthy WHERE db_name=‘sbtest’ AND table_name=‘sbtest1’;
Manually analyzed, now it’s 100%, but the problem still exists.
Changed to order by id, can’t retrieve, timeout and killed.
Moved to the bottom, you can take a look.
The rpt_time is high, and the entire scan of kv to retrieve data takes a long time. It might be due to some occasional operations causing TiKV not to trigger compaction. You can try doing it manually to see if it can reduce read amplification.
The cause of this issue has been roughly identified. This table actually has over 200,000 records and is part of an hourly task in the data warehouse. They delete the entire table every hour. TiDB has an MVCC mechanism, which results in many historical versions existing. Garbage Collection (GC) is performed every 12 hours, meaning each record has approximately 12 historical versions. When querying with LIMIT 10;, does it scan the historical versions of the data? I rebuilt a table, inserted the data, and LIMIT 10; returned in 0.06 seconds. I understand that querying data scans all deleted versions. Can someone explain the principle behind this?
Is it here? If GC is working properly, it should delete historical versions, right?
I think it might be because you repeatedly delete and insert, causing too many regions corresponding to this table.
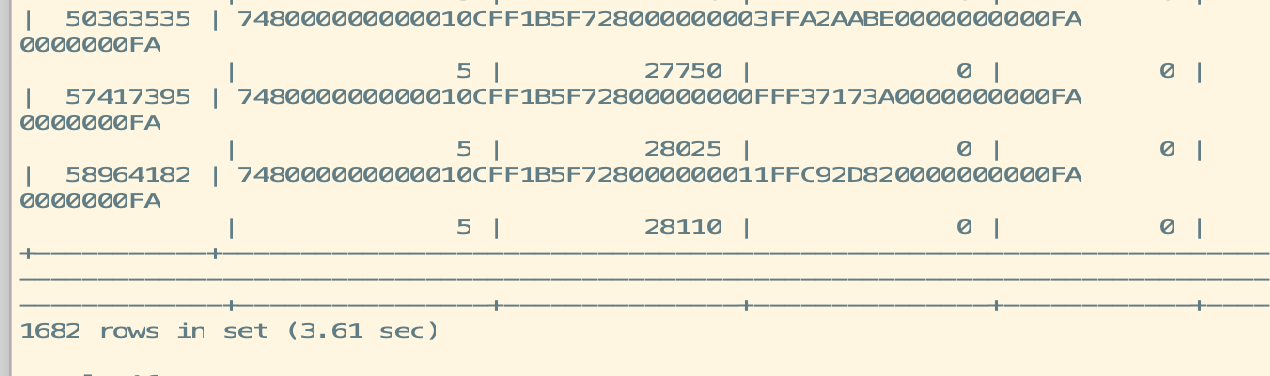
SELECT * FROM INFORMATION_SCHEMA.TIKV_REGION_STATUS a WHERE a.db_name=‘’ AND a.table_name=‘’;
Check how many regions correspond to this table. By querying this way, TiDB has to scan all the regions…
If you use the primary key index to search, you won’t encounter such a situation. You can give it a try.
1682, that’s quite a lot, isn’t it?
This topic was automatically closed 60 days after the last reply. New replies are no longer allowed.