Note:
This topic has been translated from a Chinese forum by GPT and might contain errors.
Original topic: 为何auto analyze table总是失败,而人工执行analyze table却能成功呢?
[TiDB Usage Environment] Production Environment
[TiDB Version] 5.2.2
[Encountered Problem: Phenomenon and Impact]
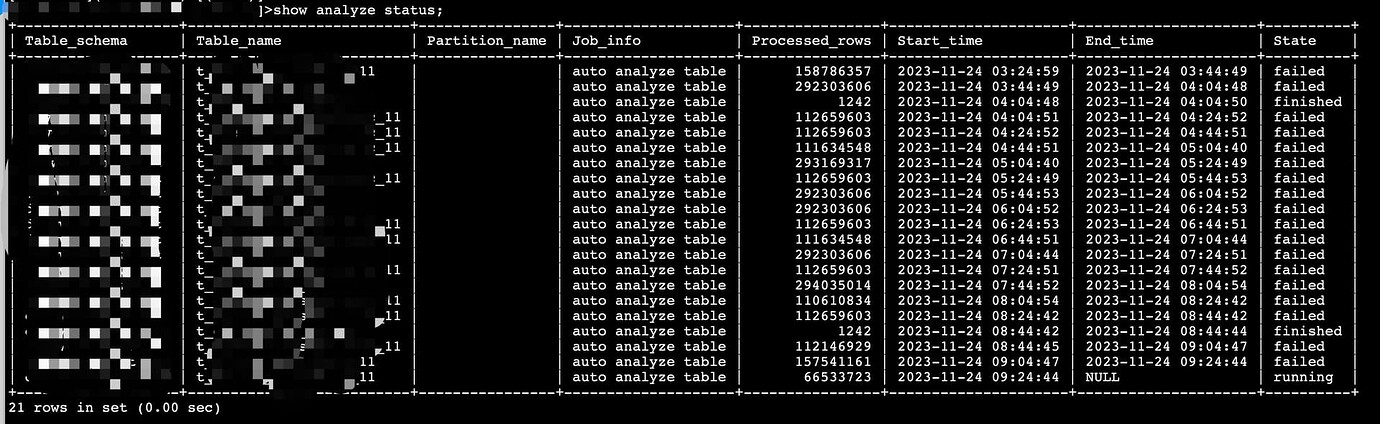
Why does auto analyze table always fail, while manually executing analyze table succeeds? Is there any difference between the two analyze operations? This issue has occurred many times in this cluster.
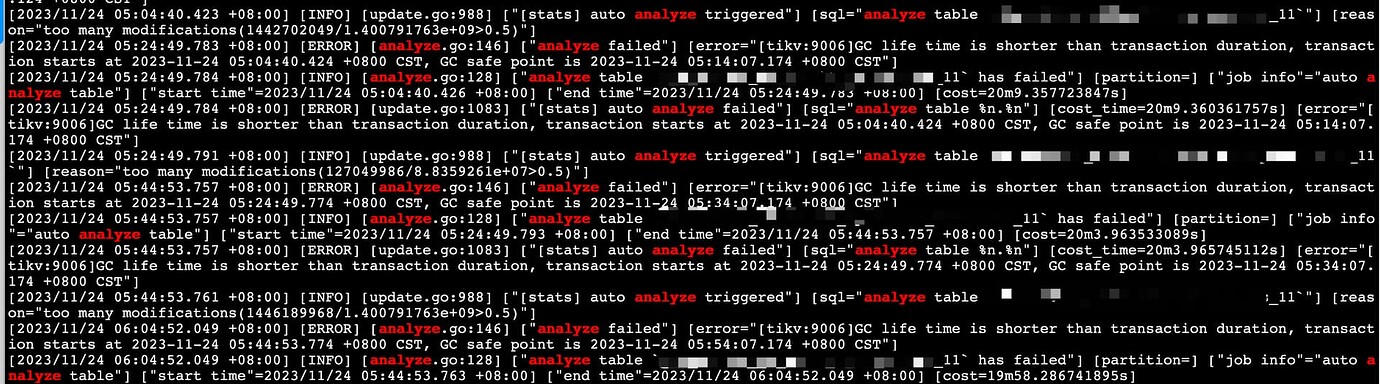
tidb.log regarding analyze logs:
Automatic analyze is single-threaded, and large tables fail due to GC issues. When executed manually, there are several build-related variables that can control the degree of concurrency.
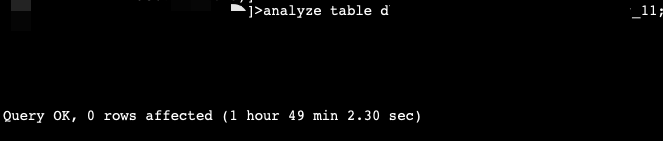
However, manual analyze also takes nearly 2 hours, far exceeding the tidb_gc_life_time setting. Why is that?
The level of concurrency is different.
From the logs you posted, it can be confirmed that the auto analyze failed due to exceeding the GC safepoint. This is because earlier versions did not consider automatically extending the GC safepoint duration for background tasks. This was improved in version 6.x to reduce GC failures. For long-running foreground tasks, the safepoint duration can be extended automatically. You can try manually analyzing after exceeding the GC safepoint and then check the safepoint time using the following command: pd-ctl service-gc-safepoint.
Automatic analysis is quite slow.
It’s not a matter of being slow or not; the automated process reports an error after 20 minutes.
How can this be converted to time?
select TIDB_PARSE_TSO(9223372036854775807);
or
tiup ctl:v<CLUSTER_VERSION> pd -u https://127.0.0.1:2379 tso {TIMESTAMP}
It seems that “show global status like ‘tidb_gc_safe_point’;” should also work.
It should be caused by the influence of parameters.
This topic was automatically closed 60 days after the last reply. New replies are no longer allowed.