Note:
This topic has been translated from a Chinese forum by GPT and might contain errors.
Original topic: tiup playground环境drop个小表12s,执行一次,为啥dashboard慢SQL显示多次?
[Test Environment] TiDB
[TiDB Version] tiup playground v6.0.0
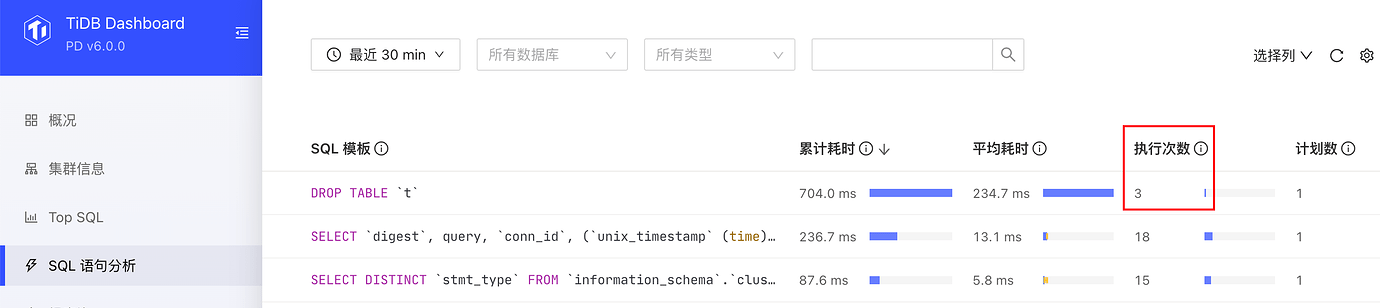
[Problem Description] Dropping a table takes 12 seconds, and the dashboard shows 2 slow SQLs in the slow SQL section. Why?
Restarted the database and tested another table. The deletion was relatively fast, but the execution count showed it was executed 3 times.
root@127.0.0.1:4000[hqh]>show create table t\G
*************************** 1. row ***************************
       Table: t
Create Table: CREATE TABLE `t` (
  `id` int(11) NOT NULL,
  `name` varchar(20) DEFAULT NULL,
  PRIMARY KEY (`id`) /*T![clustered_index] NONCLUSTERED */
) ENGINE=InnoDB DEFAULT CHARSET=utf8mb4 COLLATE=utf8mb4_bin
1 row in set (0.01 sec)

root@127.0.0.1:4000[hqh]>select count(0) from t;
+----------+
| count(0) |
+----------+
|        1 |
+----------+
1 row in set (0.00 sec)

root@127.0.0.1:4000[hqh]>drop table t;
Query OK, 0 rows affected (0.23 sec)
Is there such a big difference in the execution count?
Amazing, it actually changed back to 1 time again.
TiUP Playground is just a trial version… If you want something even simpler, you can directly use cloud services to experience it.
If you have performance requirements and want to do a POC, it is recommended to set up a configuration according to the official guidelines.
I suddenly discovered this issue and want to figure out why it changes. I’ll test it in the testing environment later to see if the execution count also changes.
In the test environment V5.1.1, the execution count seen in the SQL execution analysis on the dashboard is correct. This issue was not reproduced.
It might be an intermediate process, and it will become consistent later.
This topic was automatically closed 60 days after the last reply. New replies are no longer allowed.