Note:
This topic has been translated from a Chinese forum by GPT and might contain errors.Original topic: explain analyze 中的Projection_9 为什么会有Concurrency:5 ?
Dear teachers, I have a question regarding the experiment on the customer and orders tables under the tpch database. I noticed that the execution plan includes a Projection_9 with Concurrency:5 in the explain analyze output. I don’t quite understand this, as Projection is supposed to be projection, right?
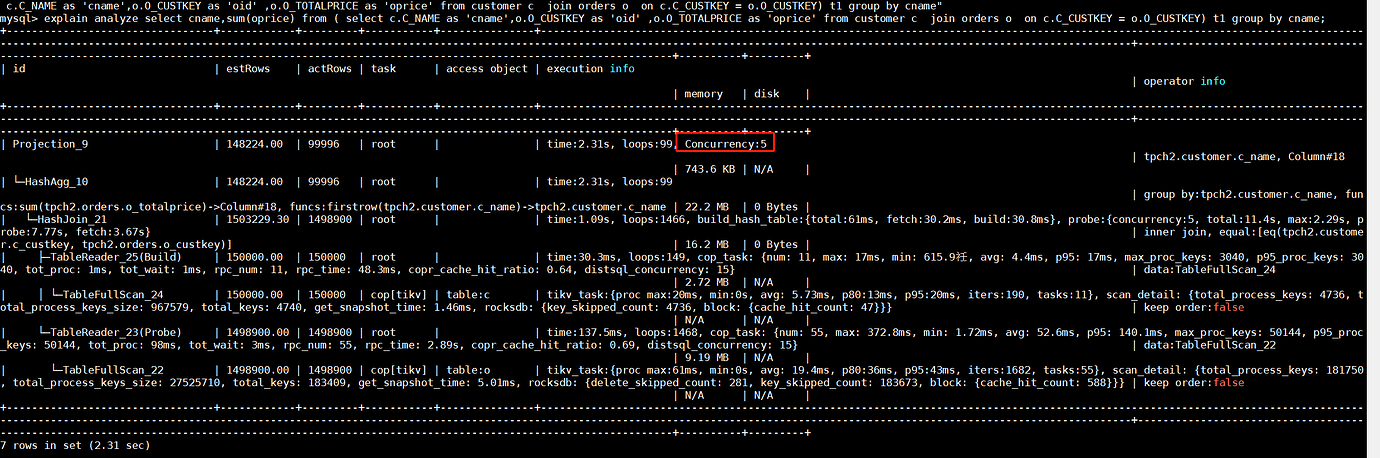
mysql> explain analyze select cname, sum(oprice) from ( select c.C_NAME as 'cname', o.O_CUSTKEY as 'oid', o.O_TOTALPRICE as 'oprice' from customer c join orders o on c.C_CUSTKEY = o.O_CUSTKEY) t1 group by cname;
| id | estRows | actRows | task | access object | execution info | operator info | memory | disk |
|---|---|---|---|---|---|---|---|---|
| Projection_9 | 148224.00 | 99996 | root | time:2.31s, loops:99, Concurrency:5 | tpch2.customer.c_name, Column#18 | 743.6 KB | N/A | |
| └─HashAgg_10 | 148224.00 | 99996 | root | time:2.31s, loops:99 | group by:tpch2.customer.c_name, funcs:sum(tpch2.orders.o_totalprice)->Column#18, funcs:firstrow(tpch2.customer.c_name)->tpch2.customer.c_name | 22.2 MB | 0 Bytes | |
| └─HashJoin_21 | 1503229.30 | 1498900 | root | time:1.09s, loops:1466, build_hash_table:{total:61ms, fetch:30.2ms, build:30.8ms}, probe:{concurrency:5, total:11.4s, max:2.29s, probe:7.77s, fetch:3.67s} | inner join, equal:[eq(tpch2.customer.c_custkey, tpch2.orders.o_custkey)] | 16.2 MB | 0 Bytes | |
| ├─TableReader_25(Build) | 150000.00 | 150000 | root | time:30.3ms, loops:149, cop_task: {num: 11, max: 17ms, min: 615.9µs, avg: 4.4ms, p95: 17ms, max_proc_keys: 3040, p95_proc_keys: 3040, tot_proc: 1ms, tot_wait: 1ms, rpc_num: 11, rpc_time: 48.3ms, copr_cache_hit_ratio: 0.64, distsql_concurrency: 15} | data:TableFullScan_24 | 2.72 MB | N/A | |
| │ └─TableFullScan_24 | 150000.00 | 150000 | cop[tikv] | table:c | tikv_task:{proc max:20ms, min:0s, avg: 5.73ms, p80:13ms, p95:20ms, iters:190, tasks:11}, scan_detail: {total_process_keys: 4736, total_process_keys_size: 967579, total_keys: 4740, get_snapshot_time: 1.46ms, rocksdb: {key_skipped_count: 4736, block: {cache_hit_count: 47}}} | keep order:false | N/A | N/A |
| └─TableReader_23(Probe) | 1498900.00 | 1498900 | root | time:137.5ms, loops:1468, cop_task: {num: 55, max: 372.8ms, min: 1.72ms, avg: 52.6ms, p95: 140.1ms, max_proc_keys: 50144, p95_proc_keys: 50144, tot_proc: 98ms, tot_wait: 3ms, rpc_num: 55, rpc_time: 2.89s, copr_cache_hit_ratio: 0.69, distsql_concurrency: 15} | data:TableFullScan_22 | 9.19 MB | N/A | |
| └─TableFullScan_22 | 1498900.00 | 1498900 | cop[tikv] | table:o | tikv_task:{proc max:61ms, min:0s, avg: 19.4ms, p80:36ms, p95:43ms, iters:1682, tasks:55}, scan_detail: {total_process_keys: 181750, total_process_keys_size: 27525710, total_keys: 183409, get_snapshot_time: 5.01ms, rocksdb: {delete_skipped_count: 281, key_skipped_count: 183673, block: {cache_hit_count: 588}}} | keep order:false | N/A | N/A |
7 rows in set (2.31 sec)