Note:
This topic has been translated from a Chinese forum by GPT and might contain errors.
Original topic: 为什么分析表的语句内存占用显示很大
[TiDB Usage Environment] Production Environment / Testing / PoC
[TiDB Version] 7.5
[Reproduction Path] What operations were performed when the issue occurred
[Encountered Issue: Issue Phenomenon and Impact]
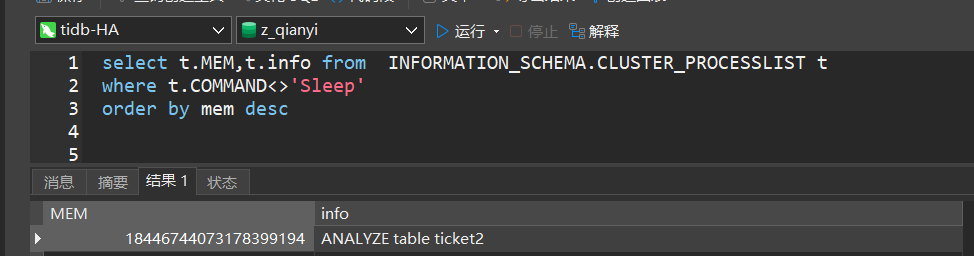
Performed an ANALYZE table ticket2; on a partitioned table with 27 million rows, which took about 3 minutes. During the analysis, the memory usage observed in the processlist was particularly high.
It seems to be a display error, do you have such a large memory?
Convert to GB to see the specific value.
It should be a display error. Humans don’t have machines with such large memory yet.
This number is ridiculously large. If it can be reproduced, it should be considered a bug.
This should be the cumulative value, not the single value, so everyone, please don’t get it wrong.
Even if accumulated, it’s too outrageous. We are testing a small database with not much memory.
I consider the memory in the processlist to be just for fun, it’s not accurate at all…
Is there a reliable way to check session memory usage?
Even the cumulative value of the formula is not very accurate, it’s too large.
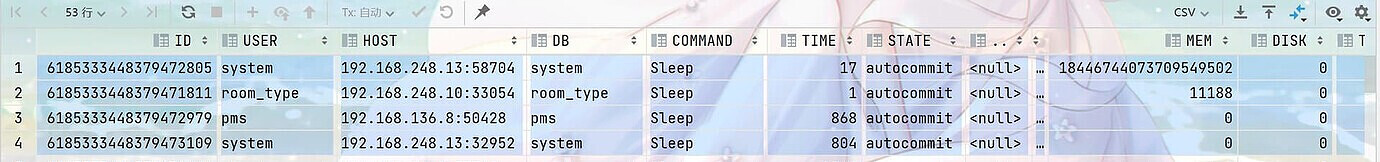
The cumulative value of these multiple tasks.
As far as I remember, there is no place to view session-level memory usage in real-time.
Logs do print SQL statements that use too much memory, and you can view instance-level memory usage through Grafana, but the granularity is too coarse.
Memory usage observability is currently a key feature that TiDB urgently needs to optimize.
It should be the cumulative value. It is estimated that the table is too large and the analyze was not completed in one go. Encountering GC or other situations caused the analyze to restart, and then the memory accumulated.
It’s not an accumulated value. Everyone, take a look at this issue [1]
17 seconds with such a large MEM:
There is a pattern. Starting with 1844, is it an address?
I saw another post that also starts with 1844.
This issue has been present since version 4.0. It feels like this table is very convenient for troubleshooting performance issues, so why hasn’t it been resolved yet? 
mem field in information_schema.processlist display abnormal · Issue #18588 · pingcap/tidb · GitHub
Checking memory usage is not helpful; generally, you should see if there are any SQL queries that are taking a long time to execute.