Note:
This topic has been translated from a Chinese forum by GPT and might contain errors.
Original topic: tidb-server不停重启,为什么
[Test Environment] TiDB
[TiDB Version] v6.1.1
[Reproduction Path] After shutting down the virtual machine and restarting, the tidb-server remains down
[Encountered Problem: Phenomenon and Impact]
After shutting down and restarting the virtual machine, the tidb-server remains down. Only one node is deployed for tidb-server, while pd and tikv each have three nodes.
The tidb-server is deployed on node B. Upon inspection, it is found that the TIDB-SERVER service process is always present, but it automatically restarts approximately every 2 minutes. Even if the process is killed, it will restart.
This is a newly deployed cluster with no data. Before restarting, the command tiup cluster clean tidb1 --all was executed.
Memory and CPU are sufficient.
Seeking advice from experts, what could possibly cause the tidb-server to keep restarting?
Check the TiDB logs, and also check if the memory is insufficient.
Memory and CPU are sufficient, but this TiDB error is quite strange.
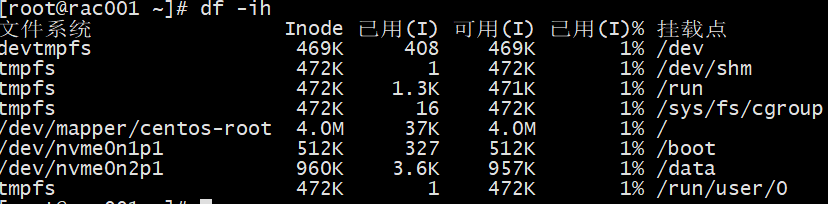
In fact, the disks of the three nodes are only used less than 50%.
df -ih
Check if the inodes are full.
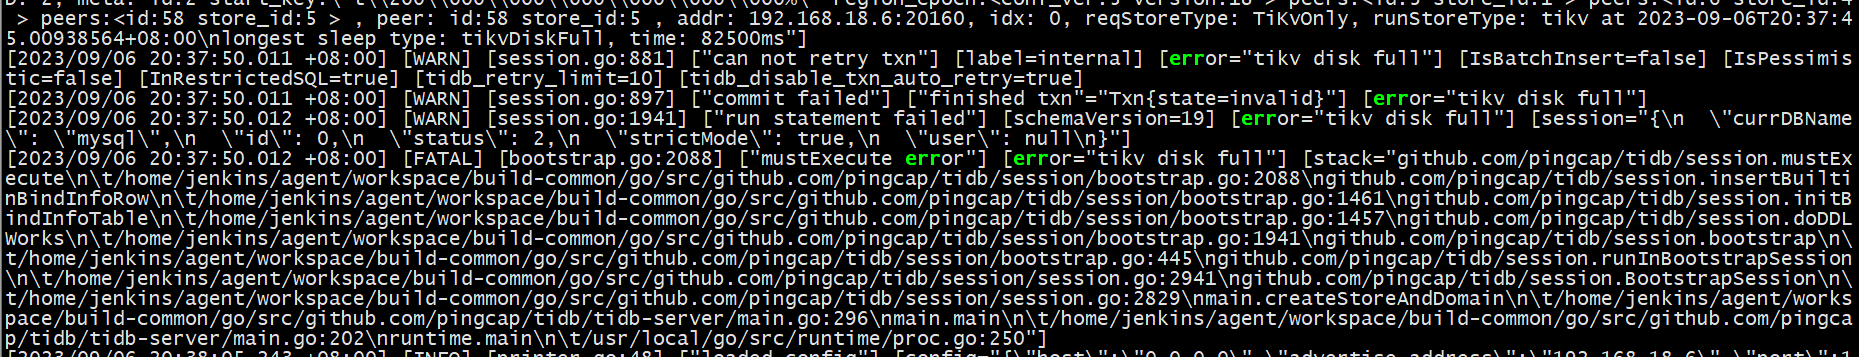
If TiKV disk is full and it’s not just slow, there might be an issue with TiKV. Check the TiKV logs.
TiKV log error
Why does it report that the region has no leader when using clean --all or clean --data?
Checked with pd-ctl, and it is indeed as the error message suggests.
Virtual machine? Any changes in the network? Is communication with PD normal?
Oh, I remember a situation where a cluster was frequently adding and deleting, and eventually, we found that the monitoring showed insufficient space, but the physical disk space was sufficient. In the end, it seemed that either restarting the cluster or scaling it up or down made the monitoring normal.
It was like the monitoring showed unreleased space, but the physical space was actually released. It felt like the monitoring statistics were not updated.
Try restarting each node one by one.
I checked it out, and that’s it.  In the end, we had to rebuild the cluster~
You can check the disk usage of TiKV from the Grafana monitoring page to see if the cluster has not been cleaned up properly.