Note:
This topic has been translated from a Chinese forum by GPT and might contain errors.
Original topic: 一条sql显示慢在not(isnull(字段)),是什么原因?
【TiDB Usage Environment】Production Environment
【TiDB Version】
【Reproduction Path】What operations were performed that led to the issue
【Encountered Issue: Issue Phenomenon and Impact】
【Resource Configuration】Go to TiDB Dashboard - Cluster Info - Hosts and take a screenshot of this page
【Attachments: Screenshots/Logs/Monitoring】
Testing sql.sql (11.3 KB)
Untitled.xlsx (12.0 KB)
time:1.38s, loops:830, cop_task: {num: 121, max: 89.5ms, min: 432.2µs, avg: 13.3ms, p95: 44.4ms, max_proc_keys: 20480, p95_proc_keys: 20478, tot_proc: 936ms, tot_wait: 290ms, rpc_num: 121, rpc_time: 1.6s, copr_cache_hit_ratio: 0.11, distsql_concurrency: 15}, tikv_task:{proc max:48ms, min:0s, avg: 9.12ms, p80:22ms, p95:35ms, iters:1116, tasks:121}, scan_detail: {total_process_keys: 584729, total_process_keys_size: 178611036, total_keys: 584909, get_snapshot_time: 14.1ms, rocksdb: {key_skipped_count: 1169046, block: {cache_hit_count: 8000, read_count: 24, read_byte: 39.7 KB, read_time: 72.7µs}}}
Does the result of process_keys above match your expectations?
key_skipped_count: 1169046 (Is there a large amount of deletion in the table data?)
There should not be a large amount of data being deleted during the query.
The key_skipped_count is the number of MVCC versions that have not yet been garbage collected. Both update and delete operations will cause this number to rise. If there were a large number of delete or update operations before the SQL execution, then this value might be correct. You can check the GC time you have set; if it is long, you can appropriately reduce it. This way, the MVCC will be significantly reduced, and it won’t scan too much useless data.
I didn’t see any areas that could be optimized.
What is the issue with SQL?
Could you please post the specific SQL?
The image is not visible. Please provide the text you need translated.
The value of key_skipped_count: 1,169,046 is a bit large. Check the cluster GC settings and see if you can speed it up. After re-running the GC, running the SQL should be faster.
not(isnull(et.atdpersonpaycode.paycode))
Corresponding to ON AC.id = PCODE.paycode
When PCODE goes back to the table, it needs to find rows where paycode is not null (this is slow) and then perform a hash join with AC.
It looks like the index selection is not very reasonable. Try analyzing the PCODE table first.
First, manually analyze the involved tables, then execute the select statements in the WITH clause separately to check the speed and the amount of returned data.
isnull should not use an index.
Already analyzed this table, it’s useless.
I tested that as long as there is a join query in TiDB, there will be this isnull.
Please post the SQL and execution plan after anonymizing them.
I don’t understand what desensitization means, but the execution plan and SQL are both here.
Sorry, I clicked earlier thinking it was an image 
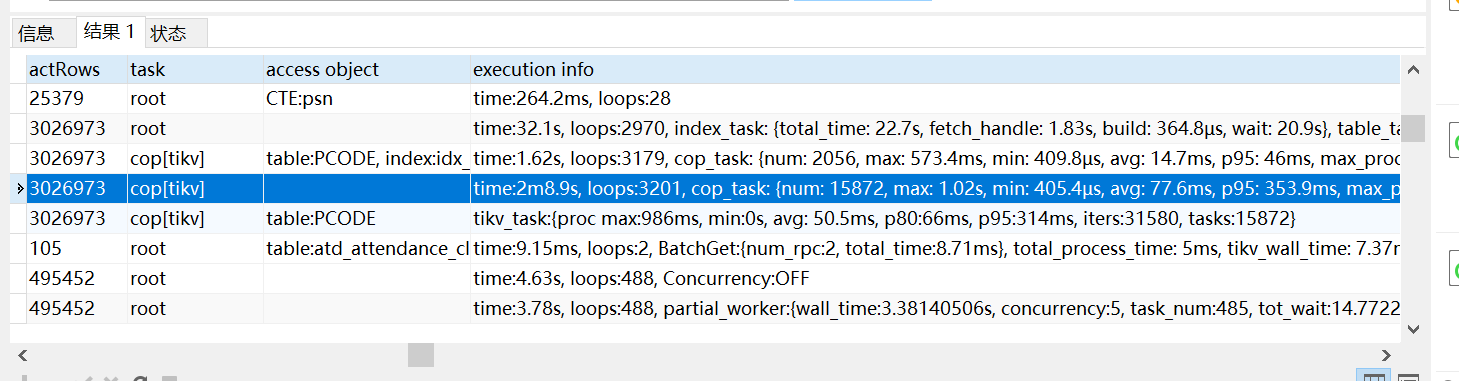
In the execution info, the time represents the total wall time from entering the operator to leaving the operator, including the total execution time of all sub-operator operations. If the operator is called multiple times by the parent operator (loops), this time is the cumulative time. Loops is the number of times the current operator is called by the parent operator.
In your SQL, it can be understood as the time taken for PCODE to return to the table after index scanning. Here, 3,026,973 rows are returned to the table, which is too many, so it is slow. You can try to make the PCODE table use HASH JOIN.
What is the function of hash join that you mentioned? How does it work, what is the principle, and are there any articles to learn from?