Note:
This topic has been translated from a Chinese forum by GPT and might contain errors.
Original topic: tikv某节点leader region频繁掉线是杂回事?
[TiDB Usage Environment] Production Environment
[TiDB Version] v4.0.9
[Encountered Problem: Phenomenon and Impact]
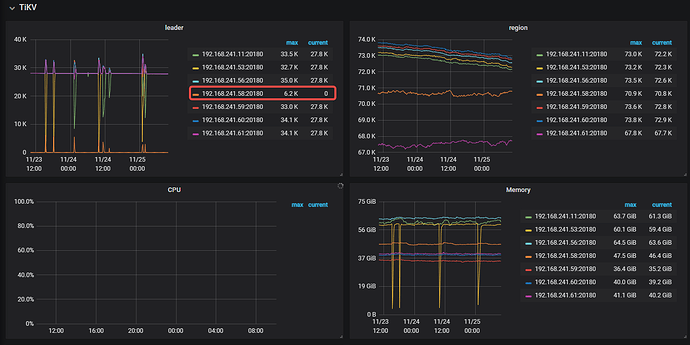
The leader region of the TiKV node 192.168.241.58:20180 frequently goes offline (as shown in the picture below, not sure if my description is accurate). Could you please explain what triggers this situation? I have checked the system logs and found nothing abnormal. Thank you~
The number of regions on this TiKV is not small in the cluster, but the leader is often always 0. Occasionally, when some leaders increase, they quickly go down. It’s quite strange~
[Resource Configuration]
[Attachment: Screenshot/Log/Monitoring]
The logs of this node should be provided.
I have checked the PD logs and didn’t find any error logs that match this timestamp. How should I investigate this? The logs are quite large, how can I filter keywords?
Look for keywords such as error, ERROR, warn, WARN.
Then check if there is the word “welcome” in tikv, indicating that it has restarted…
It is estimated that it has restarted… 
The fact that “welcome” wasn’t filtered out indicates that it hasn’t been restarted. There are quite a few “heartbeat fail” logs, but the timestamps don’t quite match the times shown in the graph.
The number of leaders on this TiKV node has always been 0, and the server load isn’t high either, which is quite strange.
I’ve checked the monitoring values and didn’t find any anomalies, but the monitoring generally collects data at a longer interval of 1 minute per time. Is there a good way to check? The only thing I can think of is to find another machine to continuously ping.
There is a very simple way: find another server with the same configuration and directly expand it into a TiKV node instance. Once the expansion is successful, you can decommission the problematic server.
Generally, PD connection issues and heartbeat problems can be attributed to network congestion, which causes PD to think that the node is down. This will trigger the transfer of all leaders and replicas to maintain service availability and replica availability.
If it’s a network issue, then the replicas on this node should all be fewer, right? But now the number of regions on this TiKV is not considered small in the cluster, and the number of regions is quite stable (no sudden increases or decreases), but the leader is often always 0, and occasionally when some leaders increase, they quickly go down. It’s quite strange~
Server resources are quite tight, so we can’t expand with new machines~
I suspect it’s a hardware issue. You’ll have to figure out how to investigate it yourself…
I’ll ping for a couple of days over the weekend to check the latency first 
Yesterday, I dealt with a similar issue. The problem was caused by GC. During GC, resolve lock can cause some nodes to be under too much pressure, leading to a pseudo-deadlock. Then PD will immediately evict the leader, and after the node recovers, PD will rebalance the leader again, causing such a scenario.
You can check the time when your leader dropped and see if it matches the resolved locks in the GC section of the TiKV details monitoring. I guess they should be consistent. Then you can see the IO at that time; GC scan_lock can cause IO to be fully utilized and similar issues.
I have been pinging for several days, and the packet loss is very minimal, which does not match the leader disconnection anomaly. It should be possible to rule out network issues.
I feel that the expert’s answer is correct. I checked the monitoring of this node, and the iowait indicator of this machine is not high and relatively balanced. The ioutil in the cluster is also not considered high (our machines are all ordinary SATA SSDs, not using NVMe, so the disk ioutil is generally higher). You mentioned that this issue should be random for the TiKV nodes, right? My current problem is that the leader on this one TiKV node frequently goes offline.
Try analyzing the store and region status changes through the PD log using the store ID of the frequently disconnected TiKV leader and a specific region ID. Check if there are any unexpected scheduling issues causing this.
What method did you use to deploy TiDB?
Is this a virtual machine or a physical machine? If it’s a virtual machine, I think you can try migrating it to another host machine to see if it helps.
Why does resolving locks cause TiKV to hang?
Looking at the image in my previous comment, resolving locks can lead to a large number of scan locks requests, which may cause IO to be fully utilized, potentially resulting in TiKV becoming unresponsive.
