Note:
This topic has been translated from a Chinese forum by GPT and might contain errors.
Original topic: 为啥一个普通索引读取次数那么大
[TiDB Usage Environment] Production Environment
[TiDB Version] v5.4.0 2tidb 3pd 3tikv
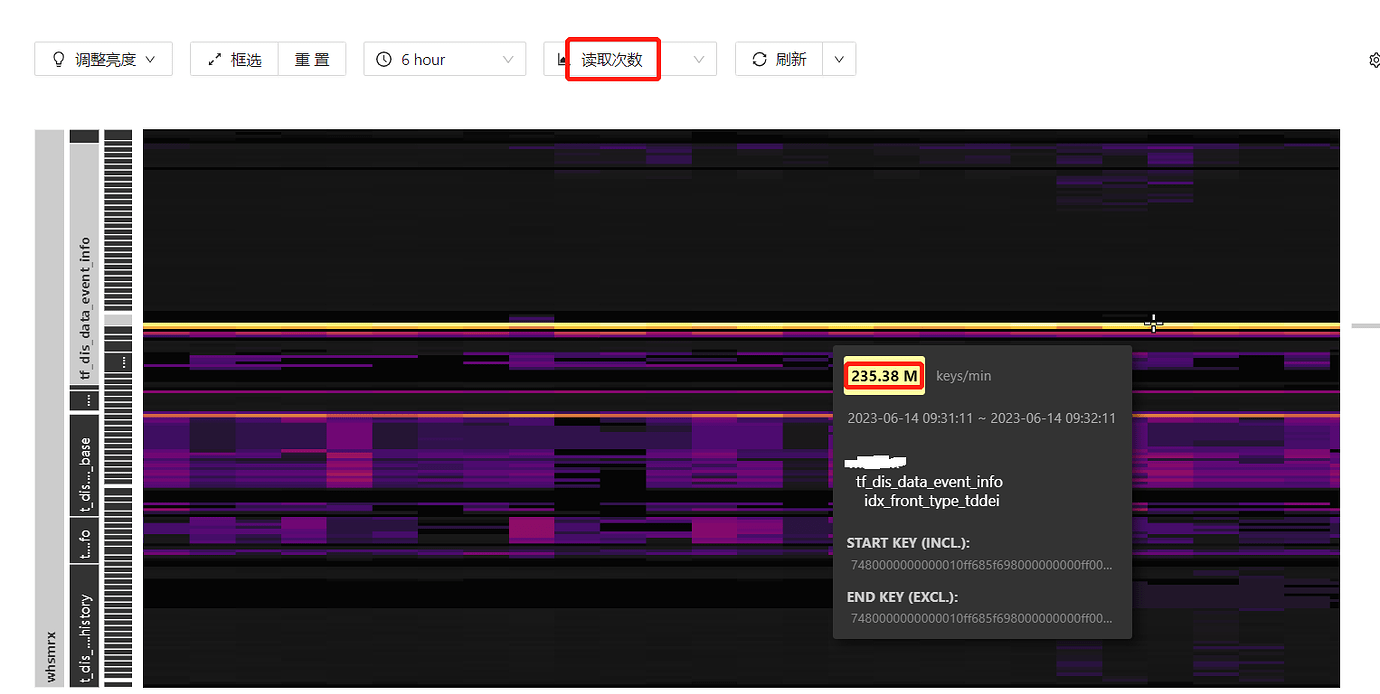
[Reproduction Path] There is an index with a high number of read operations. How is this traffic calculated, and can this index hotspot be dispersed?
[Encountered Problem: Problem Phenomenon and Impact]
[Resource Configuration] Go to TiDB Dashboard - Cluster Info - Hosts and take a screenshot of this page
[Attachment: Screenshot/Logs/Monitoring]
TiDB uses the information_schema.TIDB_HOT_REGIONS table to record information about hot regions, where the flow_bytes field indicates the read/write traffic size of that region in bytes. If an index has a high read traffic, its flow_bytes value will also be high.
To scatter this index hotspot, you can follow these steps:
- First, use the
information_schema.TIDB_HOT_REGIONS table to find information about the hot region and locate the region where the index resides.
- Then, use the command
tiup ctl:v5.3.2 pd -u http://<pd_ip>:<pd_port> operator add split-region <region_id> --policy=scan to scatter the region. Here, <pd_ip> and <pd_port> are the IP address and port number of the PD, and <region_id> is the ID of the region to be scattered.
- Finally, observe whether there is a significant decrease in traffic for the scattered region. If there is, it indicates that the scattering was successful.
It is important to note that scattering regions may lead to data inconsistency. Therefore, it is necessary to back up the data before performing the operation and to verify the data after the operation is completed.
This topic was automatically closed 60 days after the last reply. New replies are no longer allowed.