Why is there a huge time difference in executing batch DDL jobs? Experts, please help!

Note:
This topic has been translated from a Chinese forum by GPT and might contain errors.

Original topic: batch ddl job执行时间差距巨大,原因几何?大佬速来

| username: jaybing926

[TiDB Usage Environment] Production Environment / Test / Poc
[TiDB Version] v7.1.5

[Encountered Problem: Problem Phenomenon and Impact]
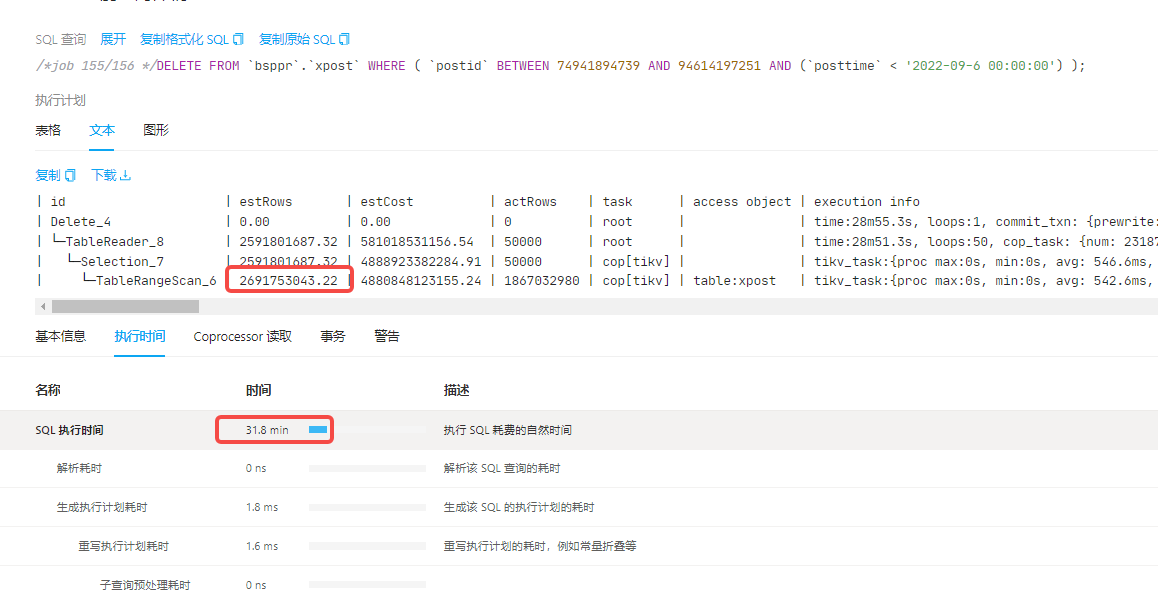
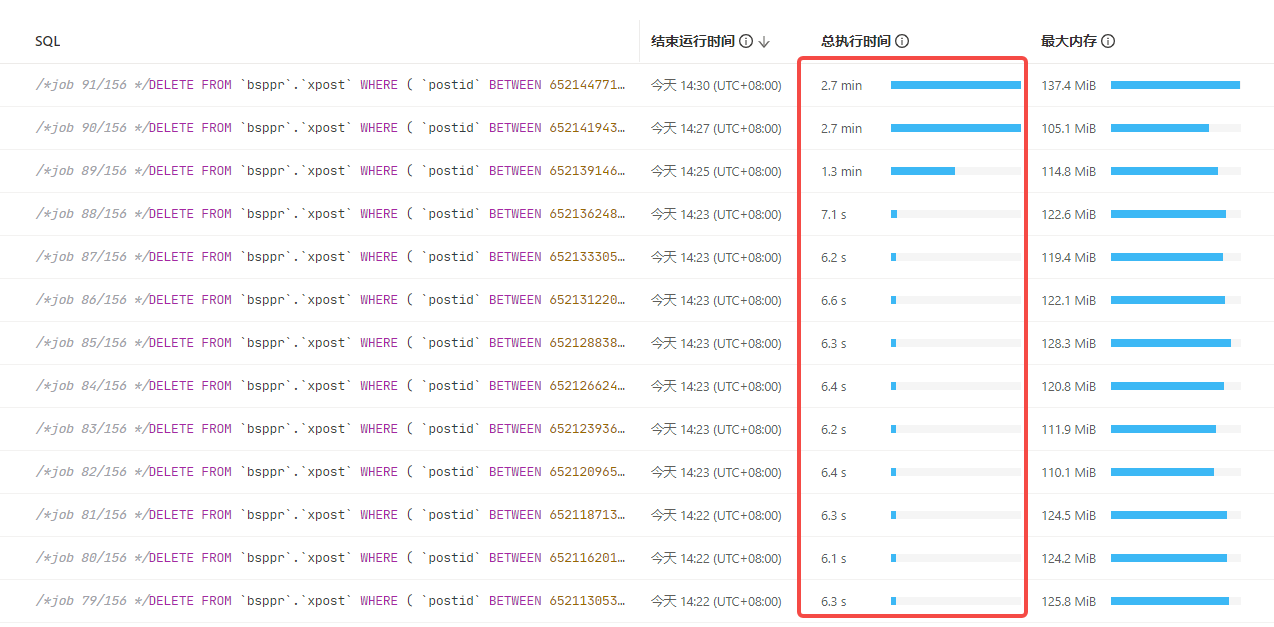
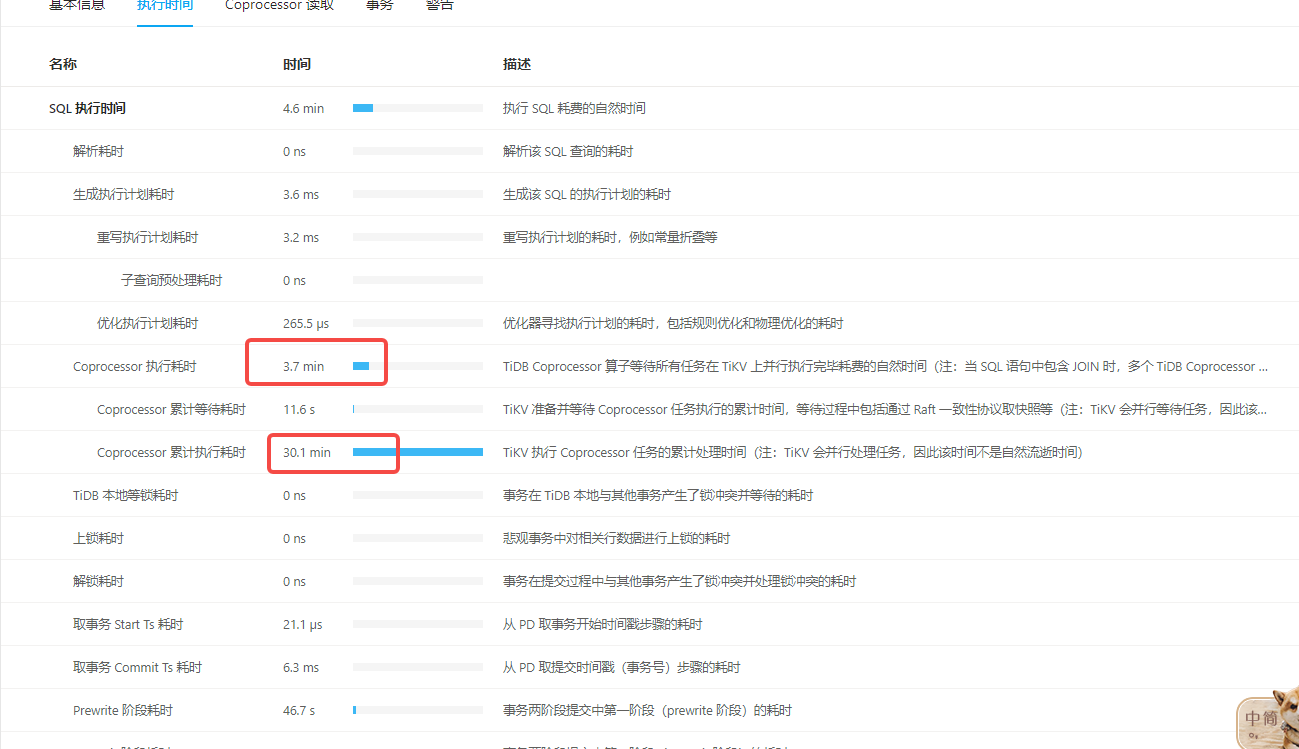
When performing historical data cleanup with batch DDL, I observed through the dashboard that the execution times of different jobs vary significantly. Could you please advise on the possible reasons for this? How can I identify the causes and optimize the process?

| id                     | estRows      | estCost         | actRows   | task      | access object | execution info                                                                                                                                                                                                                                                                                                                                                                                                                                                                                                                                                                                                                                                                                                                                                                                                                                                                                                                                                                                                                                                                                                                                                                                                                                                                                                             | operator info                                        | memory  | disk  |
| Delete_4               | 0.00         | 0.00            | 0         | root      |               | time:3m49.2s, loops:1, commit_txn: {prewrite:46.7s, get_commit_ts:6.3ms, commit:297.5ms, backoff: {time: 2ms, prewrite type: [regionMiss]}, slowest_prewrite_rpc: {total: 2.891s, region_id: 9894450, store: 192.168.241.73:20160, tikv_wall_time: 1.07s, scan_detail: {get_snapshot_time: 490.3µs, rocksdb: {block: {cache_hit_count: 5343, read_count: 29, read_byte: 1.87 MB, read_time: 12.6ms}}}, write_detail: {store_batch_wait: 1.04ms, propose_send_wait: 0s, persist_log: {total: 242.6µs, write_leader_wait: 455ns, sync_log: 145.8µs, write_memtable: 1.79µs}, commit_log: 8.33ms, apply_batch_wait: 15.7µs, apply: {total:2.39ms, mutex_lock: 0s, write_leader_wait: 43.9µs, write_wal: 104.7µs, write_memtable: 507.2µs}}}, commit_primary_rpc: {total: 0.048s, region_id: 5569392, store: 192.168.241.71:20160, tikv_wall_time: 5.96ms, scan_detail: {get_snapshot_time: 9.01µs, rocksdb: {block: {cache_hit_count: 1}}}, write_detail: {store_batch_wait: 13.3µs, propose_send_wait: 0s, persist_log: {total: 110µs, write_leader_wait: 206ns, sync_log: 58.9µs, write_memtable: 4.12µs}, commit_log: 5.31ms, apply_batch_wait: 18.2µs, apply: {total:98.7µs, mutex_lock: 0s, write_leader_wait: 0s, write_wal: 17µs, write_memtable: 32.9µs}}}, region_num:14141, write_keys:700000, write_byte:36623906} | N/A                                                  | 3.30 MB | N/A   |
| └─TableReader_8        | 230688321.49 | 51713805547.64  | 50000     | root      |               | time:3m45.1s, loops:50, cop_task: {num: 4924, max: 0s, min: 0s, avg: 692.2ms, p95: 1.62s, tot_proc: 30m3.3s, tot_wait: 11.6s, rpc_num: 4924, rpc_time: 56m48.4s, copr_cache_hit_ratio: 0.00, build_task_duration: 2.2s, max_distsql_concurrency: 15}                                                                                                                                                                                                                                                                                                                                                                                                                                                                                                                                                                                                                                                                                                                                                                                                                                                                                                                                                                                                                                                                       | data:Selection_7                                     | 8.75 MB | N/A   |
|   └─Selection_7        | 230688321.49 | 435137300408.14 | 50000     | cop[tikv] |               | tikv_task:{proc max:1.99s, min:10ms, avg: 397.2ms, p80:526.5ms, p95:742.7ms, iters:290274, tasks:4924}, scan_detail: {total_process_keys: 274445988, total_process_keys_size: 337825055131, total_keys: 275092768, get_snapshot_time: 10.2s, rocksdb: {delete_skipped_count: 678094, key_skipped_count: 550436231, block: {cache_hit_count: 120229, read_count: 5747801, read_byte: 114.1 GB, read_time: 2m30.3s}}}                                                                                                                                                                                                                                                                                                                                                                                                                                                                                                                                                                                                                                                                                                                                                                                                                                                                                                        | lt(bsppr.xpost.posttime, 2022-09-06 00:00:00.000000) | N/A     | N/A   |
|     └─TableRangeScan_6 | 239584685.96 | 434418546350.26 | 274445988 | cop[tikv] | table:xpost   | tikv_task:{proc max:1.99s, min:10ms, avg: 393.6ms, p80:521.7ms, p95:736ms, iters:290274, tasks:4924}                                                                                                                                                                                                                                                                                                                                                                                                                                                                                                                                                                                                                                                                                                                                                                                                                                                                                                                                                                                                                                                                                                                                                                                                                       | range:[65420090874,67171096795], keep order:false    | N/A     | N/A   |
| username: 像风一样的男子 | Original post link

When deleting a large amount of data at once, using a loop will become increasingly slow because each deletion traverses from the beginning. After the initial deletions, a significant number of deletion markers will remain for a short period (which will be cleaned up by GC later), affecting subsequent Delete statements.

| username: tidb狂热爱好者 | Original post link

BATCH ON post._tidb_rowid LIMIT 1 delete from post where id>1
| username: h5n1 | Original post link

TableRangeScan_6, actRows: 274445988, range: [65420090874, 67171096795] = 1751005921. The range is too large.

| username: jaybing926 | Original post link

The deletion time doesn’t seem to follow a pattern; it’s not getting progressively slower. I checked the GC time, and it doesn’t seem to fluctuate either.

| username: jaybing926 | Original post link

The range of each job in batch DDL is the same, right? Why are some jobs fast and some slow?

| username: h5n1 | Original post link

Post a quick execution plan and take a look, it is probably cached.
read_count: 5747801, read_byte: 114.1 GB, read_time: 2m30.3s}}}

| username: jaybing926 | Original post link

Yes, the estRows for the slow one is much larger. Why is that?

| username: jaybing926 | Original post link

There is an even more outrageous one: processing 2 billion rows of data took 31 minutes :rofl: :rofl: :rofl:

| username: Kongdom | Original post link

:thinking: Check the flame graph, is there a hotspot?

| username: 有猫万事足 | Original post link

Is there a table structure?
The postid does not have an index, and scanning in segments is still very slow. Each delete operation scans the entire table to find 50,000 rows, which is not very efficient.

| username: yiduoyunQ | Original post link

Take a look at the table structure.

| username: TiDBer_q2eTrp5h | Original post link

If the amount of data to be deleted is huge, you can delete it in batches.

| username: h5n1 | Original post link

Calculate whether the range of id conditions for these differences is also large.

| username: tidb菜鸟一只 | Original post link

The range of postid in these two SQL queries is too large… Shouldn’t they be similar?

| username: jaybing926 | Original post link

The table structure is a bit complex, with postid as the PRIMARY KEY and auto_increment.

Does this mean that using postid as the dividing column for deletion in this batch DDL is unreasonable?

| username: Demo二棉裤 | Original post link

How about shortening the GC a bit?

| username: 像风一样的男子 | Original post link

Another way is to manually paginate the IDs and then concatenate multiple delete statements to delete the data. I did this when updating tens of billions of records before.
6.1.4 一种高效分页批处理方案 | tidb-in-action

| username: h5n1 | Original post link

How do you divide your batch SQL?

| username: jaybing926 | Original post link

I used the auto_increment field as the partition column and matched it with the deletion time column, deleting 50,000 rows each time. I’m not very familiar with this; how should I handle it properly?