Note:
This topic has been translated from a Chinese forum by GPT and might contain errors.
Original topic: 全表扫描的慢查询是否会影响其他请求
[TiDB Usage Environment] Production Environment
[TiDB Version] v4.0.15
[Reproduction Path] Slow reads cannot be reproduced by others
[Encountered Problem: Problem Phenomenon and Impact]
- Background
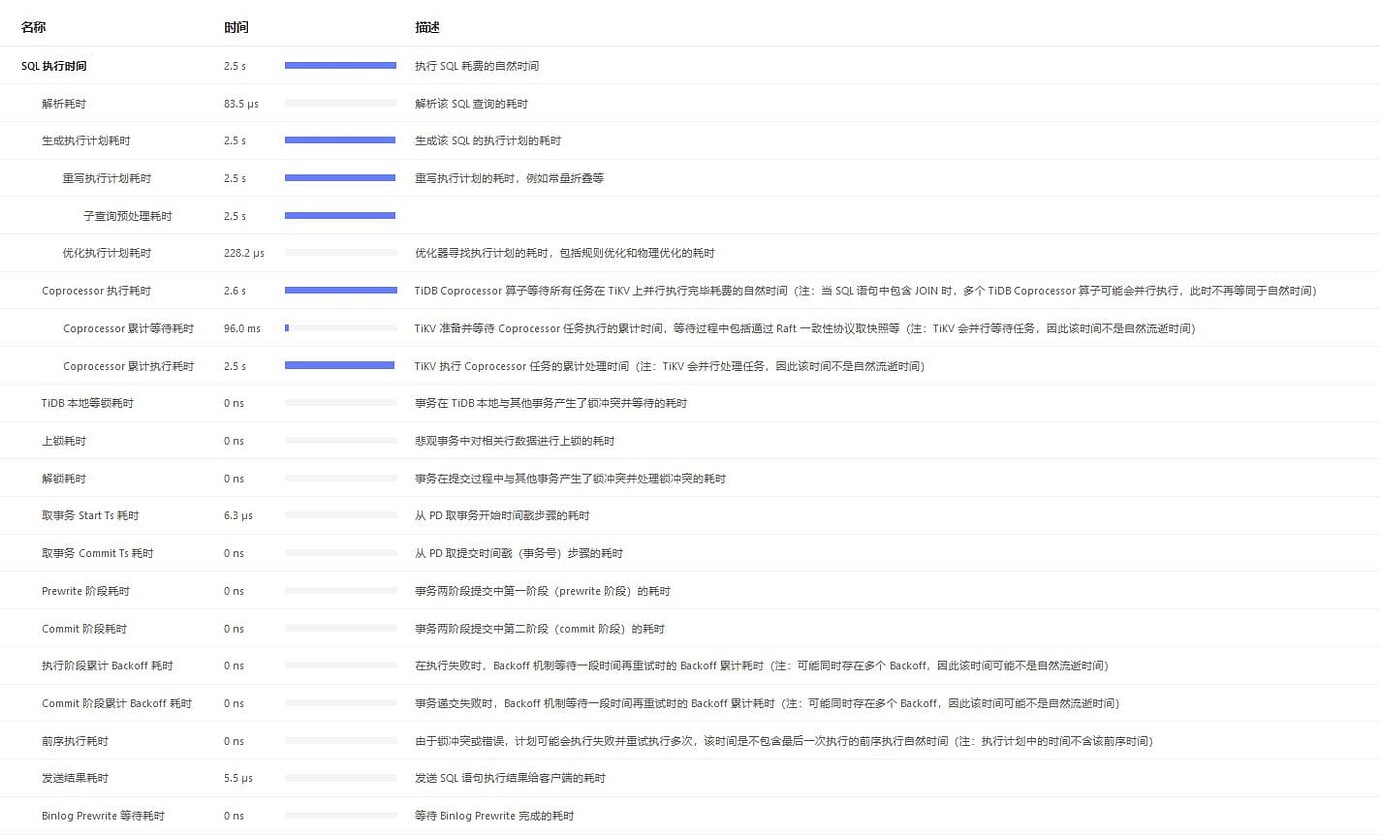
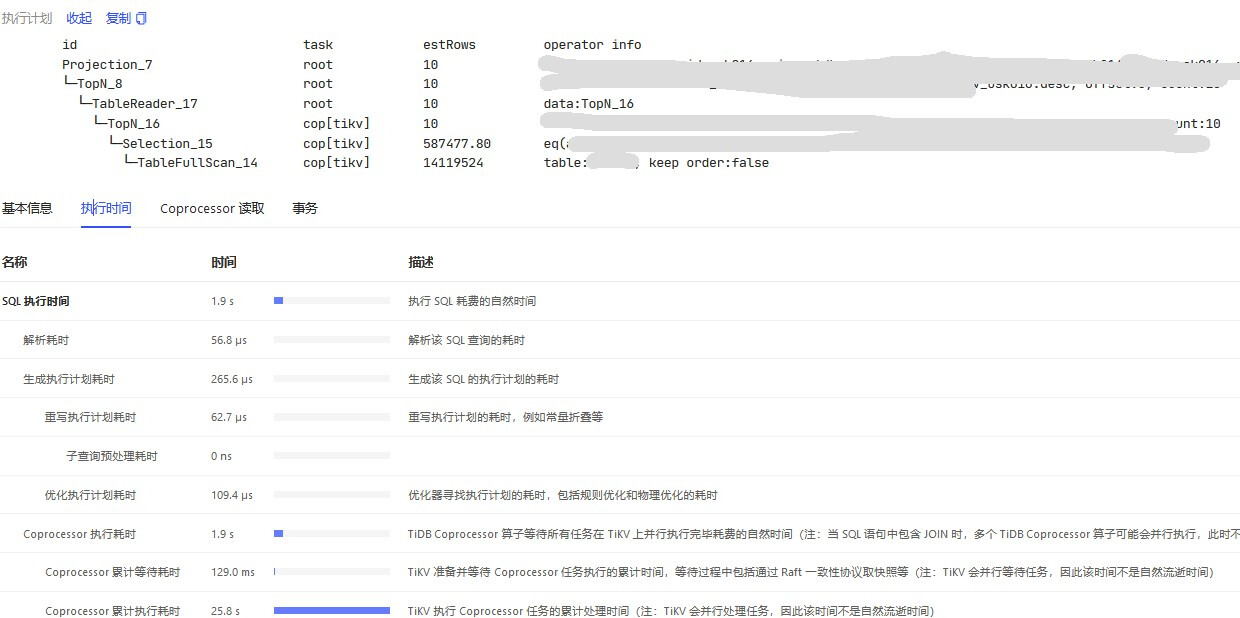
Recently, while investigating slow requests, I found that the slow SQLs for the business I am responsible for all use indexes (normally executed in 15ms, with a small number of scanned rows, and table health at 99%). The Dashboard shows that the subquery preprocessing time and Coprocessor execution time are high.
Slow request time: 00:50
2. Investigation Approach
According to:
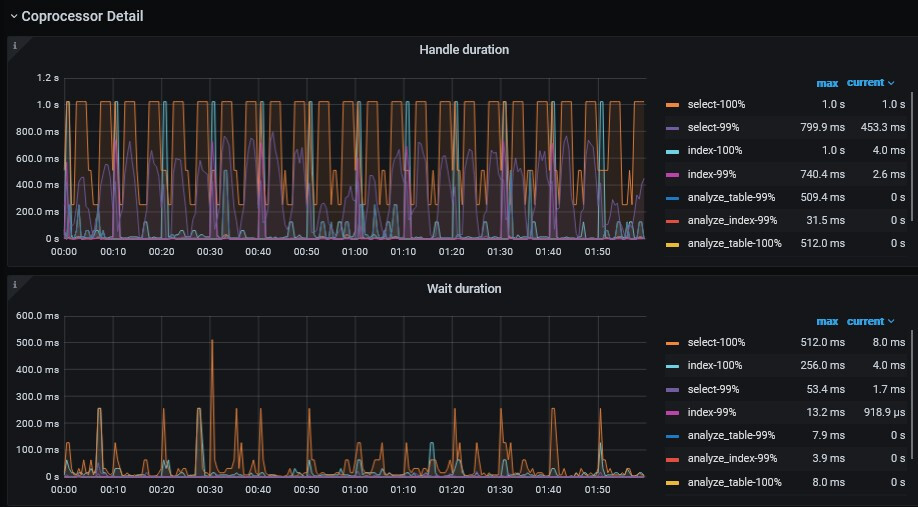
读性能慢-TiKV Server 读流程详解 - #5,来自 北京大爷 - TiDB 的问答社区, check TiKV-Details-Comprocessor Detail. Handle duration and Wait duration indeed have spikes.
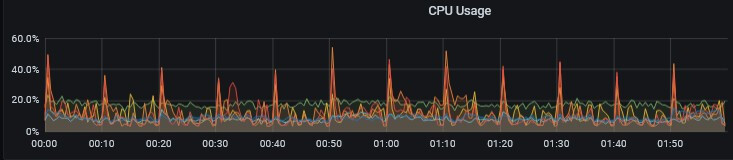
CPU has spikes, but the load is not high.
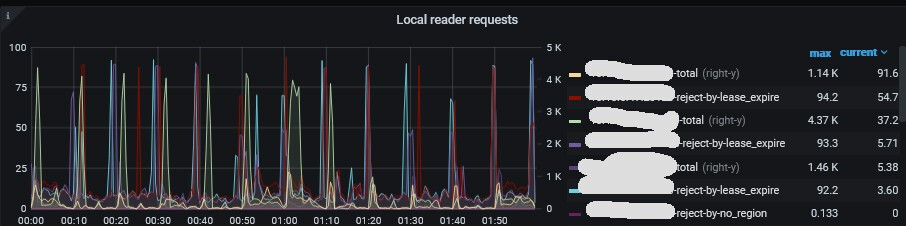
Local Reader hits mostly, with only 92.22 rejected requests.
- Personal Speculation
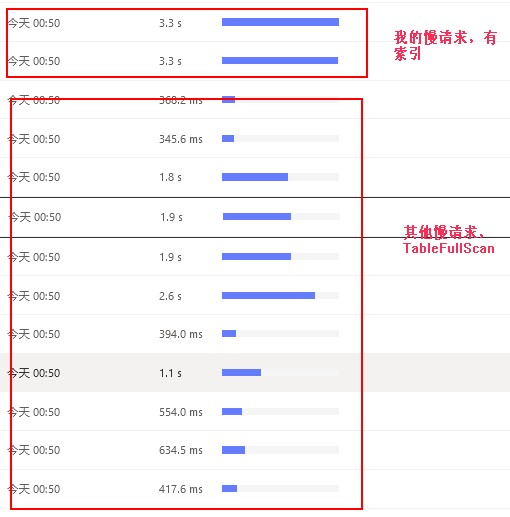
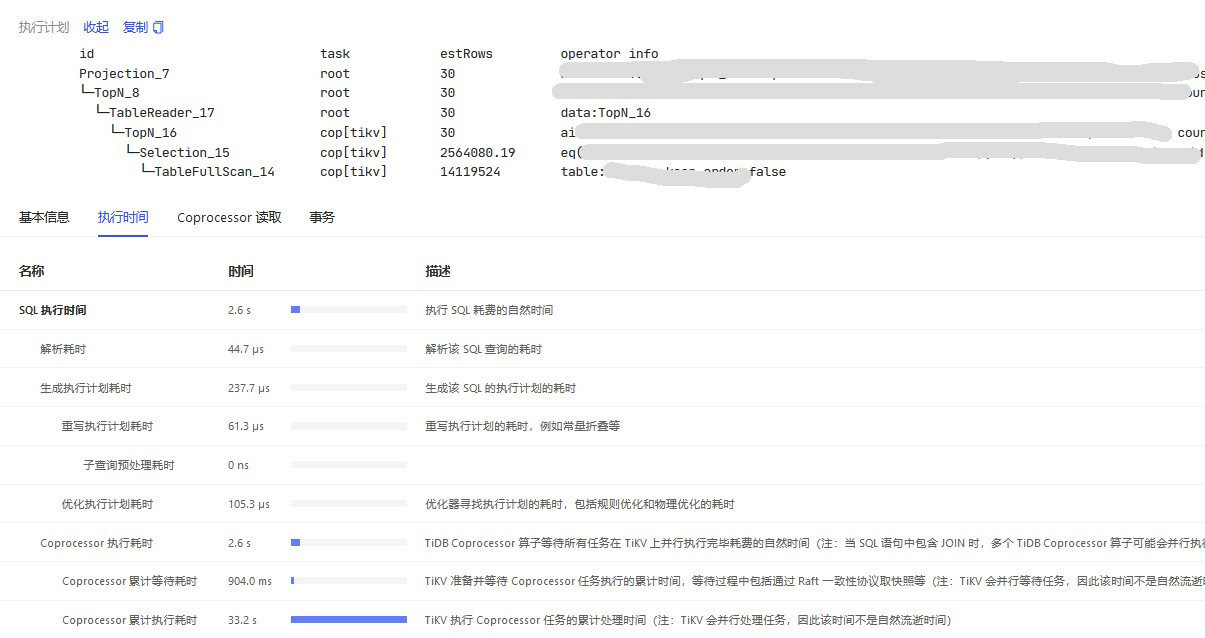
I personally speculate that other slow requests have an impact. Checking the Dashboard at the same time, there are indeed many TableFullScan requests from other businesses before the slow request I am investigating.
Examples of other slow requests:
Question: Do other full table scan slow requests affect my SQL queries? I personally understand that they do, but the operations team says that slow queries should not affect my queries if they do not impact the system. If they do, it should affect a large area, not sporadically.
Note: Other business parties’ TableFullScan will be pushed for improvement. I wonder if community members can answer this question. Is there any theoretical basis for the impact?
[Resource Configuration] 6 machines with 8 cores and 32GB mixed deployment, overall resource usage is not high.
[Attachments: Screenshots/Logs/Monitoring]
Based on our actual situation, it will have an impact. The specific theory is unclear, but it is generally assumed that a full table scan defaults to 15 copTasks. With three TiKV nodes, that averages to 5 parallel tasks per node. Therefore, multiple larger tables (exceeding 15 regions) undergoing full table scans along with multiple query executions can easily exhaust the tasks, causing others to wait. In TiKV, the priority seems to only work well for point-get operations.
One point of confusion is that if resources are fully occupied, it should affect a large number of requests. To be honest, the number of these slow requests is not that many. Looking at the Dashboard, it only affects those few of mine.
I have encountered this as well, though not as slow as yours. I didn’t understand the logic inside, and it could also be an issue with the internal queuing mechanism? For example, a request not getting resources for a long time causing some SQL to have long tail latency?
Hmm, I don’t quite understand either. I’ll wait and see if any experts or others can explain it.
TiDB supports changing the priority of global or individual statements. The priorities include:
- HIGH_PRIORITY: This statement is a high-priority statement, and TiDB will prioritize processing this statement during the execution phase.
- LOW_PRIORITY: This statement is a low-priority statement, and TiDB will lower the priority of this statement during the execution phase.
Full table scans will automatically be adjusted to low priority.
How do you explain the long execution time of a non-full table scan SQL? Is it waiting or just a coincidence? If it’s waiting, there should be a batch of requests, but I see only sporadic ones on the Dashboard.
In general, slow SQL queries tend to consume a significant amount of memory because a full table scan requires some condition comparisons. Multiple nodes will then return data to the TiDB node, and if the data volume is large, TiDB can easily run out of memory (OOM).
In the second scenario, the memory and computing resources of TiDB and TiKV nodes are occupied by slow queries. If other concurrent requests come in and need to be processed, what happens when resources are insufficient? It will lead to OOM.
In the third scenario, if there are fewer slow queries that can be released in a short time, and the resources of TiDB and TiKV nodes are sufficient to hold until the GC time arrives to help release memory… this situation is OK.
By analogy, there are too many states and factors influencing this, making it quite complex…
The fourth scenario…
…
The Nth scenario…
The above is for your reference…
There is not much fluctuation in memory. The more perplexing point is that slow requests do not seem to affect other requests unless they reach a certain level. When they do affect other requests, it should impact a batch of requests, not just a few.
Don’t get too hung up on it. Just make sure to log slow queries and look for optimization directions.
Make sure to configure the appropriate alerts and use Prometheus and Grafana frequently to help you assess…
If you have extra resources, you might consider upgrading to a new version, such as 6.1.X, and test to see if there’s any improvement.
Okay, I’ll first notify the other business parties to modify the full table scan and see the effect.
So, does that mean only 15 tasks are allowed to scan data in parallel for a table at the same time?
It’s not the same table, that one is a different table.
Is it possible to check the monitoring of tikv-details → Thread CPU —> Unified read pool CPU to observe the changes in the read thread pool? Can this monitoring item indicate some issues? I’m not sure if my thinking is correct.
It looks fine, 99% of the requests are level 0, but there are level 0 requests that take up to a few seconds, and the spikes in Run task do not correspond one-to-one. There are spikes in Run task, but the maximum is only about 20 parallel tasks.
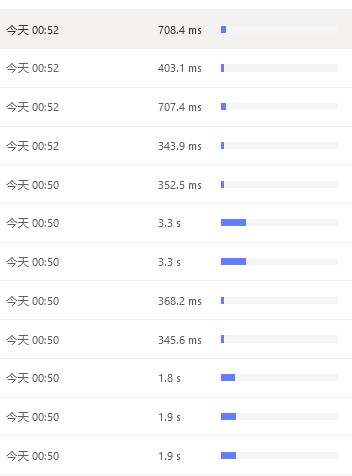
This week I finally added an index. I just checked, and indeed, the slow log appears in pairs with the slow query that didn’t have the index. However, there are still other slow logs appearing along with other full table scan queries.
This topic was automatically closed 60 days after the last reply. New replies are no longer allowed.