Note:
This topic has been translated from a Chinese forum by GPT and might contain errors.
Original topic: 写入数据 io100%
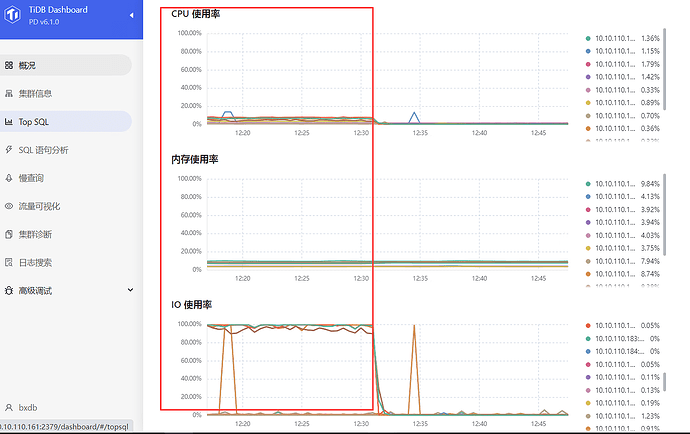
When writing data, IO performance reaches 100%, while CPU and memory usage are very low, as shown in the picture:
How can I optimize this?
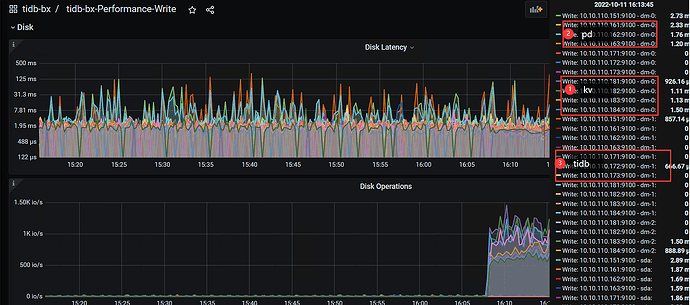
What disk? Check the Disk-Performance graph in Grafana. Look at the disk latency, IOPS, and bandwidth.
The IO utilization metric is important, but a 100% utilization does not necessarily indicate a performance issue. It needs to be considered together with latency and throughput. On many SSDs, 100% utilization does not show any problems, but on SAS SATA type disks, this metric needs attention.
What kind of disk? I have a cloud io2 type disk here. This issue has occurred before, but usage only indicates that the disk is being read or written to at the moment, not that the disk is busy. You can determine if the disk is truly busy by checking the I/O latency.
First point: feasible; the disk is SSD.
The queue for writing data is piling up.
I see your TPS is only 1500, it should be cloud SSD, like Alibaba virtual machines. Using this kind of SSD with TiDB is a bit strenuous.
Using SSD disks, self-built virtual machine cluster, not the supplier’s virtual machine.
You should test the IO. The IO of the self-built virtual machine does not meet the standard. The SSD read/write speed should be around 3000 MB/s.
It is best to deploy on bare metal. The monitoring screenshot you provided is clearly incorrect; the number of changes per second is only 1500, and it’s already maxed out. A normal SSD should handle 300,000.
For SSD disk IO testing, the write speed can reach around 200,000.
The monitoring end shows around 10k.
This topic was automatically closed 60 days after the last reply. New replies are no longer allowed.

