Note:
This topic has been translated from a Chinese forum by GPT and might contain errors.
Original topic: 写入性能干不过单机MySql,Disk IO Utilization 优化完还是 100%
To improve efficiency, please provide the following information. Clear problem descriptions can be resolved faster:
【TiDB Usage Environment】
TiDB V6.1
TiKV Configuration: 16 vCPU 64 GiB (I/O optimized) Local SSD: 1788 GiB
【Overview】 Scenario + Problem Overview
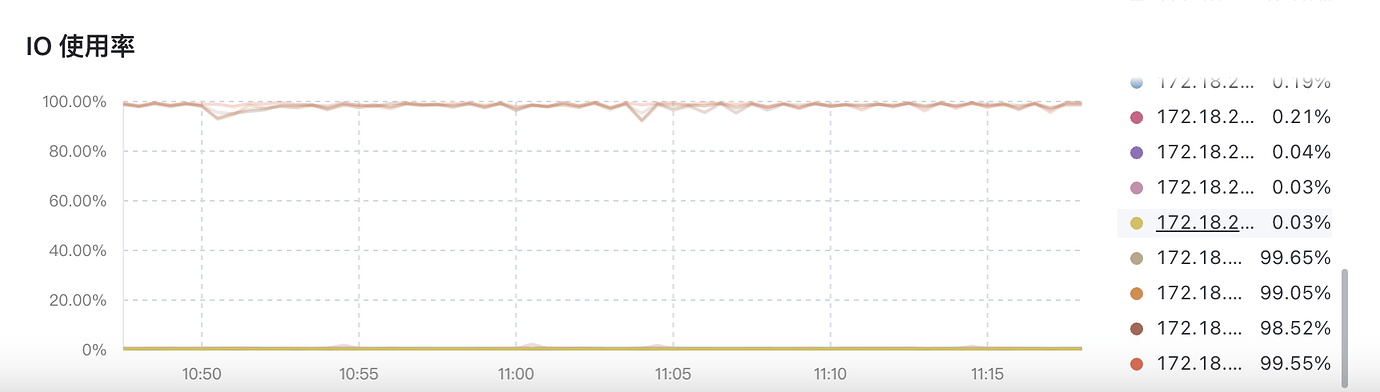
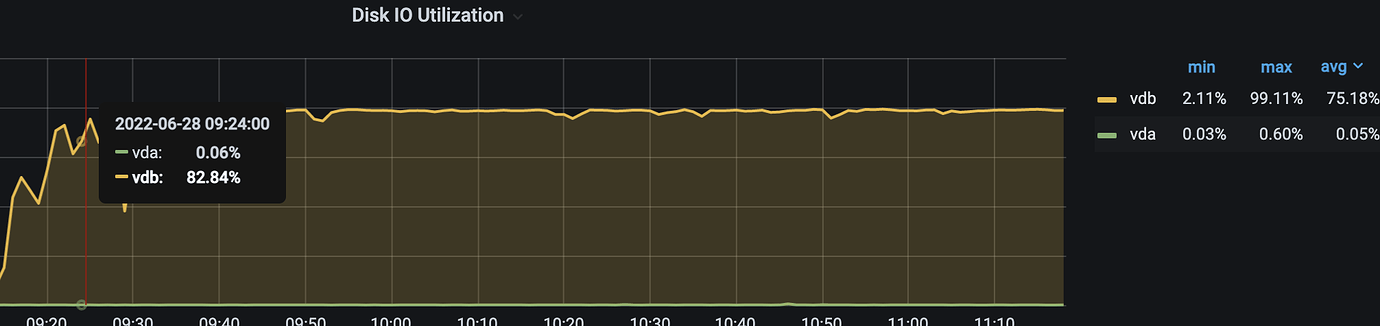
3TiDB+3TiKV cluster, the same high-frequency data writes have no delay in MySQL, but there is a delay in TiDB. Monitoring shows Disk IO Utilization is always 100%; switching from ESSD cloud disk to NVMe SSD did not solve the problem; adding one more TiKV node did not solve the problem either.
【Background】 Operations performed
Nothing was done, newly deployed cluster.
【Phenomenon】 Business and database phenomena
Business table data delay, database Disk IO Utilization almost 100%
【Problem】 Current issue encountered
How to optimize and solve the data write delay to the database, making the entry time comparable to MySQL. At the same time, reduce IO resources to reach the level of a single-machine MySQL (85%).
【Business Impact】
Data delay
【TiDB Version】
V6.1
【Application Software and Version】
【Attachments】 Related logs and configuration information
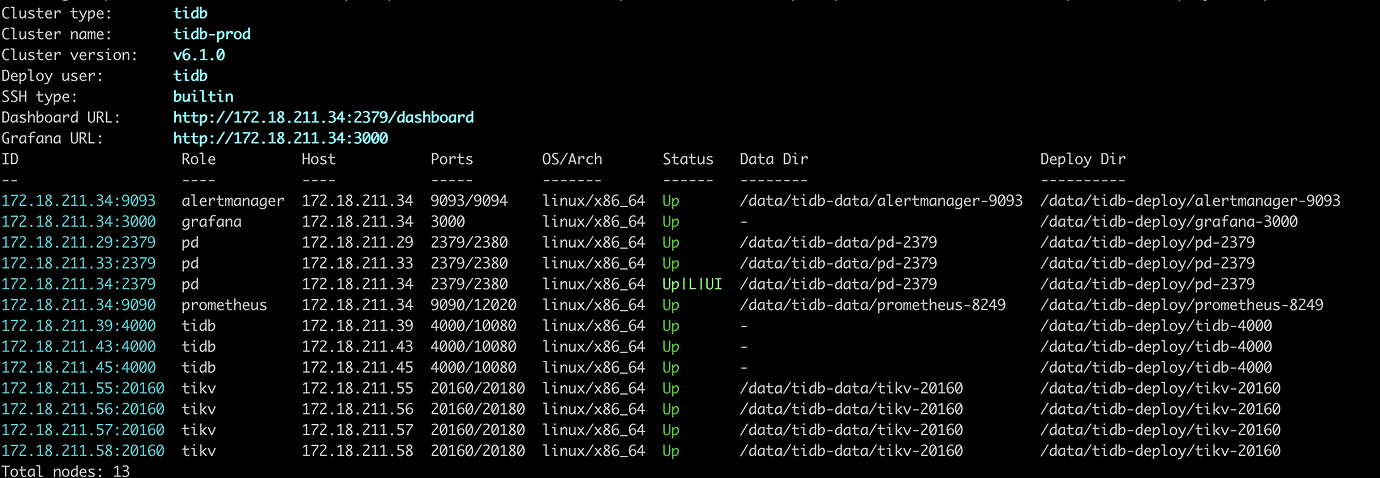
- TiUP Cluster Display information
- TiUP Cluster Edit config information
Monitoring (https://metricstool.pingcap.com/)
- TiDB-Overview Grafana monitoring
- TiDB Grafana monitoring
- TiKV Grafana monitoring
- PD Grafana monitoring
- Corresponding module logs (including logs 1 hour before and after the issue)
For questions related to performance optimization and fault troubleshooting, please download the script and run it. Please select all and copy-paste the terminal output results and upload them.
Let me think about how to answer your question first.
I’ll set the parameters first. Please modify these parameters!
Also, is the IO full on just one TiKV or is the IO full on every TiKV?
If only one machine is full, it is a write hotspot issue. You can continue to operate.
In this regard, when optimizing TiDB, we start with the table structure. For tables that use auto-increment IDs as the primary key, we rebuild them by deleting the auto-increment ID and using TiDB’s implicit _tidb_rowid column as the primary key, changing
create table t (a int primary key auto_increment, b int);
to:
create table t (a int, b int) SHARD_ROW_ID_BITS=4 PRE_SPLIT_REGIONS=2;
Each one is full. Expanding from 3 to 4 nodes, it immediately becomes full as well.
The table does not use an auto-increment primary key.
A normal machine with an IO utilization rate of 90%+ does not necessarily indicate a performance issue; it only means that disk IO operations are busy. Generally, as long as SSD r/s and w/s do not exceed 2000 and r_await and w_await do not exceed 10 milliseconds, you can determine whether there is an IO bottleneck based on the actual performance limits of the SSD.
The image is not visible. Please provide the text you need translated.
You can refer to the disk IO limits of public clouds, whether it’s a single disk or an array. You can refer to this article:
The link above provides reference values for the upper and lower limits of local disk performance.
I think we can monitor to see where the specific slowdown is.
Grafana monitoring tikv detail-raft IO append log duration: raft log writing to local rocksdb and sending to other roles.
Grafana monitoring tikv detail-raft IO commit log duration: raft log writing to local rocksdb and sending to other roles, you can appropriately adjust raft-maxinflight-msgs.
Grafana monitoring tikv detail-raft IO apply log duration: actually executing raft log and writing data into rocksdb kv. If it’s high, check whether rocksdb kv is writing slowly or experiencing flow control.
What is the write frequency for high-frequency writes? TiDB has a relatively long write path. Write operations are converted into Raft logs, which are written to RaftDB. These Raft logs then need to be applied and written to the KV DB. Locking and unlocking operations also involve data persistence. Additionally, there is internal compaction in RocksDB. High-frequency index writes require high IO utilization. Disk performance can be referenced as follows:
"IOPS is divided into read and write parts. The high IOPS claimed by cloud disks are mostly achieved through caching to improve read IOPS. Disk performance also includes bandwidth and fdatasync. TiKV requires disk sync operations during data writes to ensure data is flushed from the buffer to the hardware before returning to the business side, specifically through the fdatasync system call.
TiKV disk recommendations are a write bandwidth of over 2GB/s and more than 20K fdatasyncs per second. In tests with 4KB high-concurrency direct writes, P99.99 should be less than 3ms. You can use the latest version of fio or the pg_test_fsync tool for testing. You can add the -fdatasync=1 option for testing, for example, high concurrency with each write of 4k and each fsync:
fio -direct=0 -fdatasync=1 -iodepth=4 -thread=4 -rw=write -ioengine=libaio -bs=4k -filename=./fio_test -size=20G -runtime=60 -group_reporting -name=write_test
Performance references for fdatasync:
Reference 1: Non-NVMe SSDs have fdatasync/s of about 5~8K/s
Reference 2: Early NVMe SSDs have fdatasync/s of about 20~50K/s
Reference 3: Current mature PCIe 3 NVMe SSDs have fdatasync/s of about 200~500K/s"
Could you describe the specific test scenario in more detail? What does the table creation statement look like? Any relevant monitoring graphs? The IO utilization is very high, how is the write speed? How does it compare to MySQL?
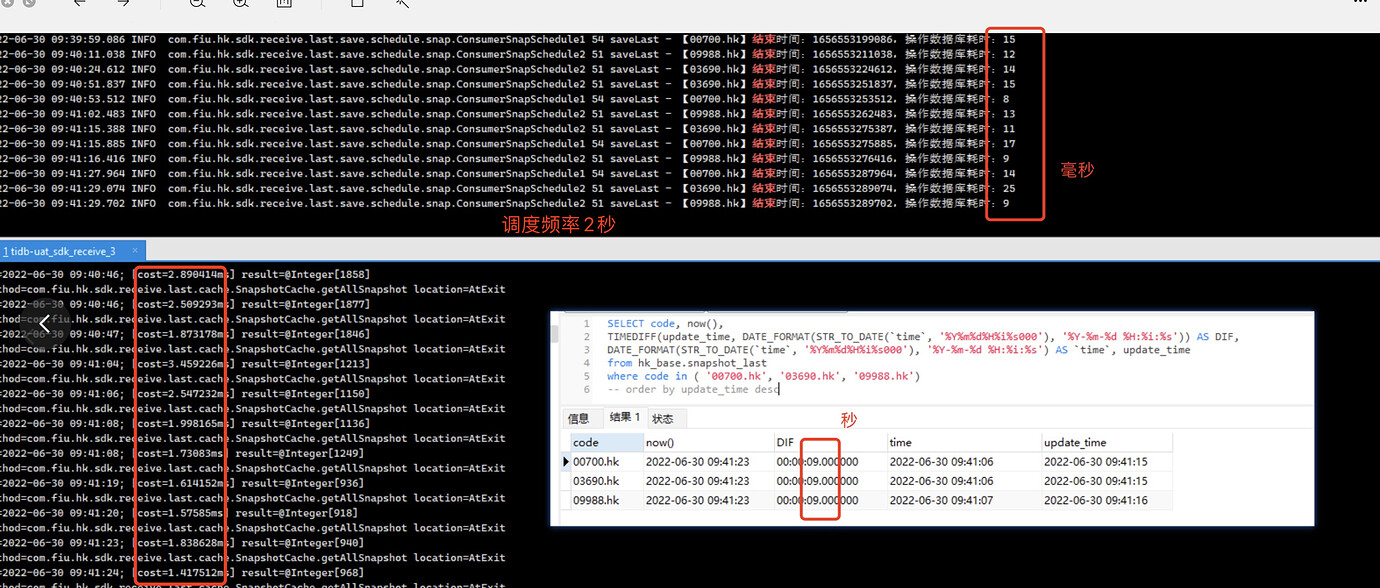
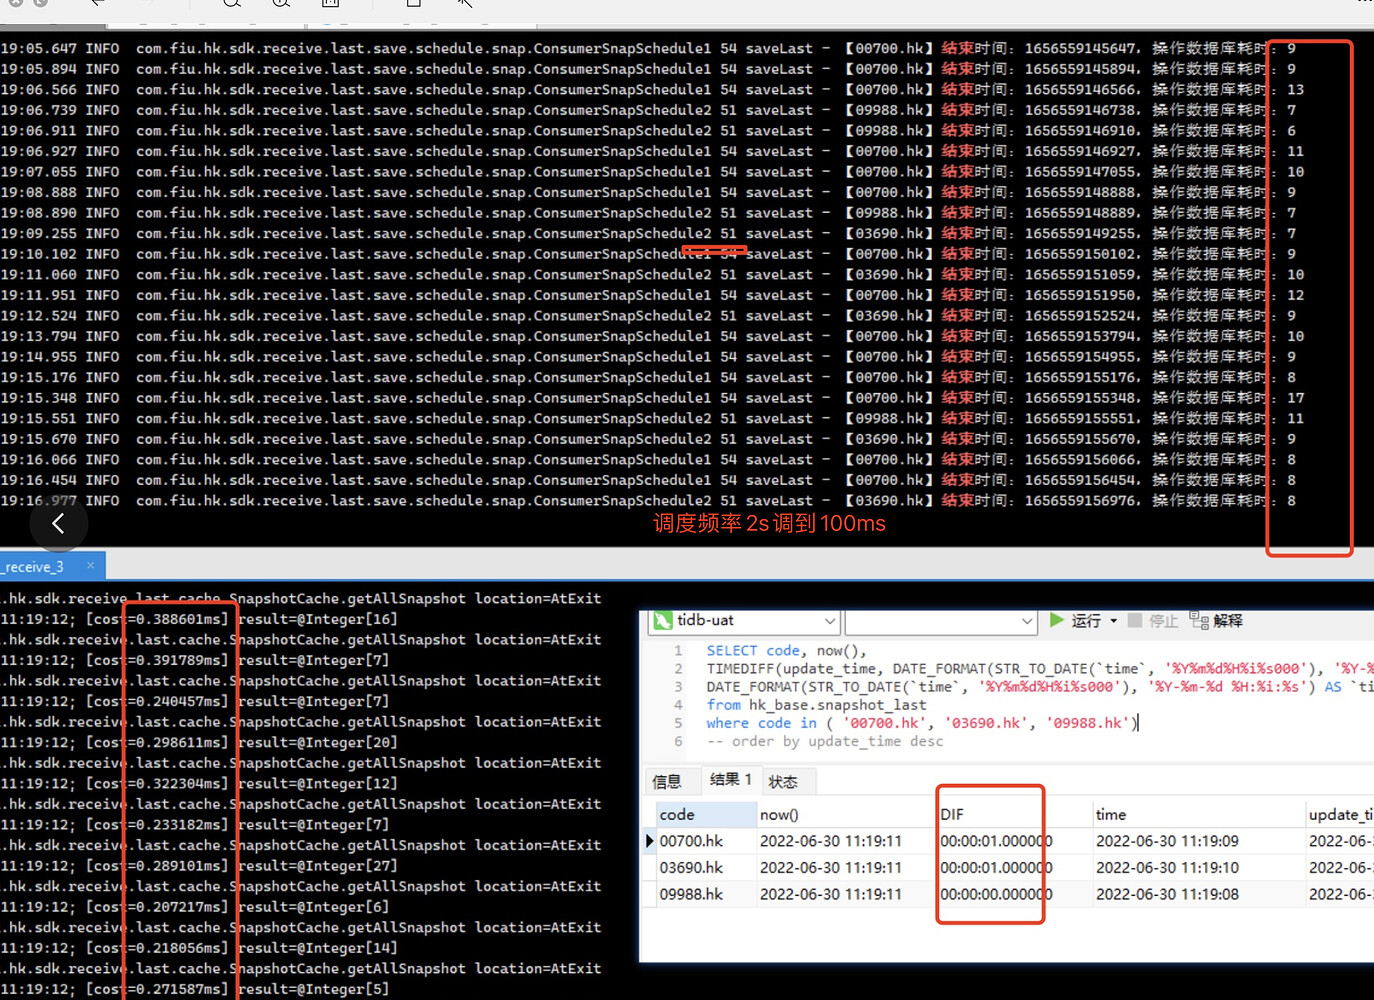
The scenario involves updating time-series data points, as shown in the screenshot. About 3000 data entries are inserted into the database in roughly 10ms. I’m not sure if this efficiency is problematic. When querying the final database, the difference between the business time and the current system time is over 10 seconds.
Currently using Alibaba Cloud’s NVMe SSD, with read and write speeds of 6GB/s and 3GB/s respectively.
Refer to the troubleshooting for slow write processes. A speed of 3000 entries in 10ms should be acceptable.
At present, it seems that there are too many idle threads in the program, leading to insufficient resource utilization. Is this MySQL performance comparison valuable? 数字中国·星火文集 | TiDB与MySQL压测对比实践 - 神州信息新闻 - 神州信息官网-成为领先的金融数字化转型合作伙伴
Your disk is constantly writing. Check if it’s frequently scheduling.