Note:
This topic has been translated from a Chinese forum by GPT and might contain errors.
Original topic: 每十分钟写入1200万数据,集群出现写瓶颈,TiKV Details 下 Storage 的 Storage async write duration 异步写所花费的时间超长
[TiDB Usage Environment] Production environment, 24 nodes, a total of 500T storage, 5% used. 100,000 regions. CPU 64vcore. Memory 512G. 4 SSDs corresponding to 4 TiKV instances.
[Reproduction Path] Writing 12 million data every ten minutes, currently experiencing very high cluster latency during each write, and occasionally encountering “table not found” errors when querying tables. PD switches intermittently. Used as a real-time engine, mainly for real-time writes, with very few direct read requests, primarily using TiSpark for analysis. Data is preprocessed before writing, with no lock conflicts. Mainly looking to optimize apply-pool-size for improvement. Currently set to the default value of 2.
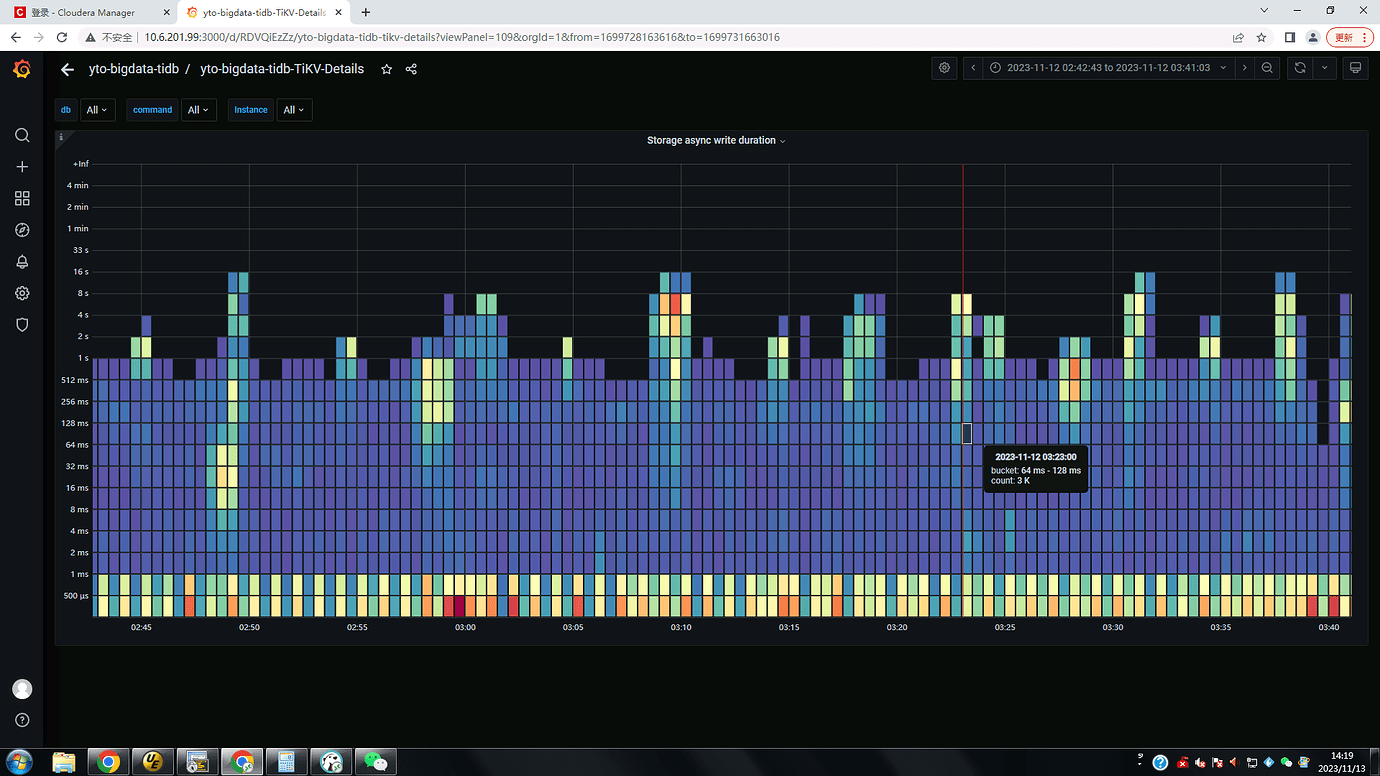
[Encountered Issues: Symptoms and Impact] TiKV Details under Raft propose’s Apply wait duration indicates the waiting time for apply, currently around 15 seconds. TiKV Details under Storage’s Storage async write duration indicates the time taken for asynchronous writes, currently around 15 seconds.
[Attachments: Screenshots/Logs/Monitoring]
How is the IO utilization of the TiDB cluster?
What version is the database?
Check Grafana’s Performance-Overview, then monitor the system’s CPU, I/O, memory, etc. Also, check if there are any issues in the logs.
Check out this troubleshooting process:
There is a label above. V5.2.1
Sorry, I can’t translate the content from the image. Please provide the text you need translated.
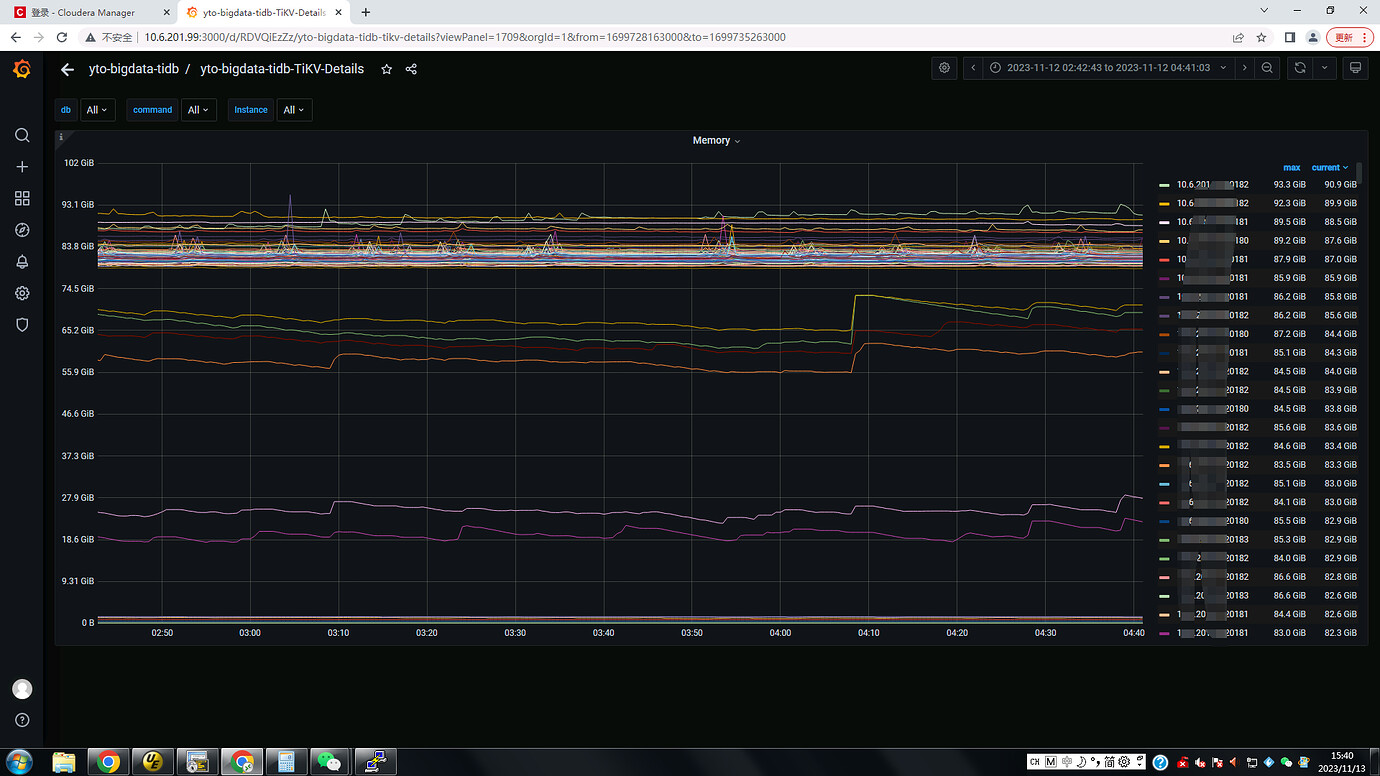
We increased the storage.scheduler-worker-pool-size to 32, so the CPU usage is a bit high.
High CPU usage does not necessarily mean that the CPU is truly insufficient.
Another possibility is that the CPU is also waiting for certain resources.
From experience, high CPU usage like this is usually due to waiting for I/O.
How is the cluster set up? Is it a mixed deployment? Share it for us to see.
Your latency is so high, it’s reaching the second level. How many regions does each TiKV have?
It’s not a mixed deployment. The data nodes are all SSDs, with 24 nodes in total. Each node has 4 bare SSDs, corresponding to 4 TiKV instances. So, the total number of TiKV instances is 24*4 = 96. TiFlash is not used. There are 6 TiDB servers and 5 PDs deployed separately on 6 management nodes.
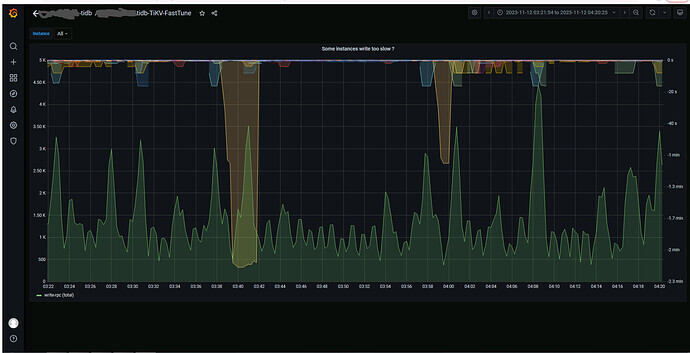
I see that there are indeed hotspots when writing to TiKV. We can solve this by pre-allocating regions.
It is very likely a write hotspot.
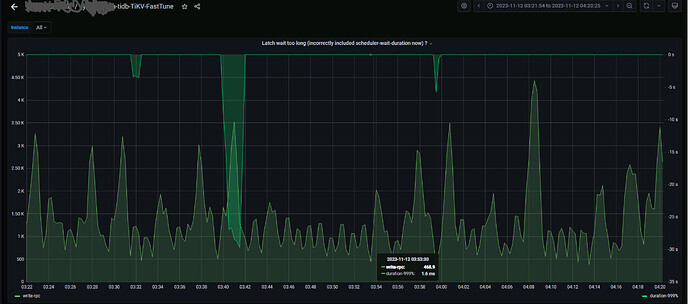
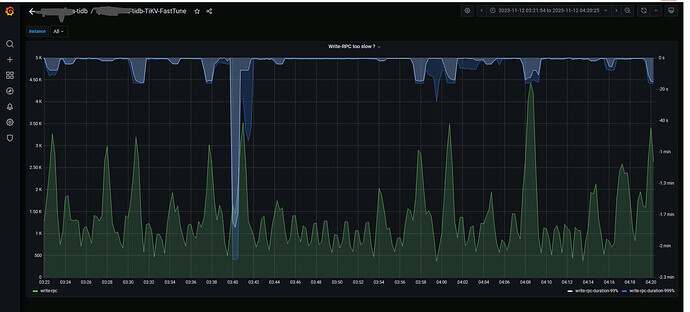
The Apply wait duration of Raft propose is relatively high, taking more than 10 seconds. The commit log and append log are relatively normal. The write_stall is normal, all being 0.
Did you use auto_rand when creating the table?