Note:
This topic has been translated from a Chinese forum by GPT and might contain errors.Original topic: TiKV集群YCSB压测,磁盘IO Util利用率80%,CPU和内存等系统资源利用率很低,写入并发量上不去
[Overview]
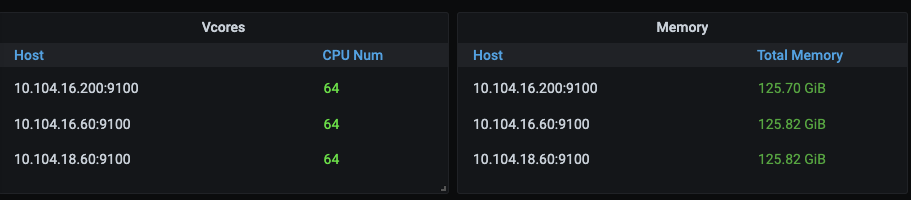
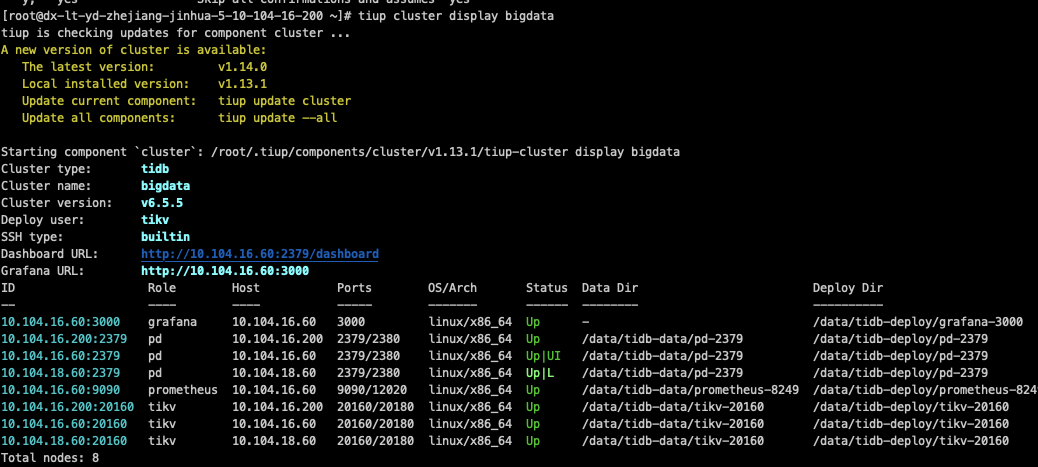
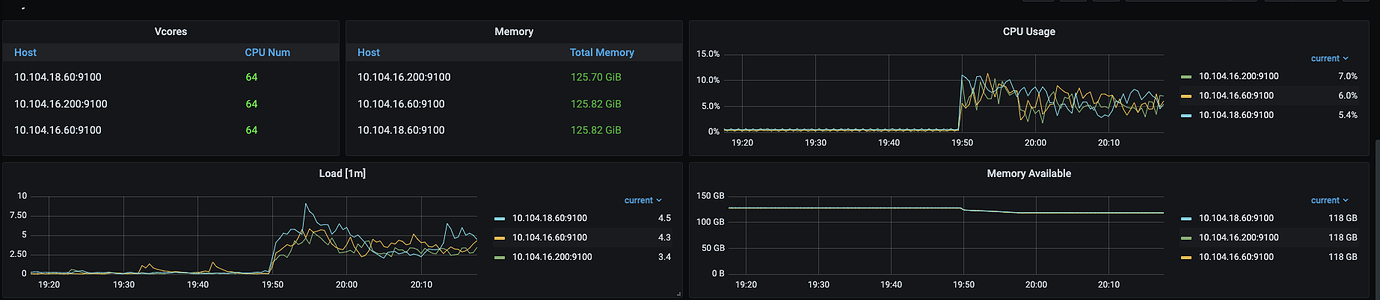
Currently, a TiKV cluster is set up using three high-configuration machines in the same data center, each with 64 cores, 128GB RAM, and 2TB NVMe SSDs. The cluster information is as follows:
Each disk has been benchmarked using the fio tool, with 64KB random writes averaging IOPS=21.4k, indicating no performance issues.

[TiKV Version]
v6.5.5
[Issue]
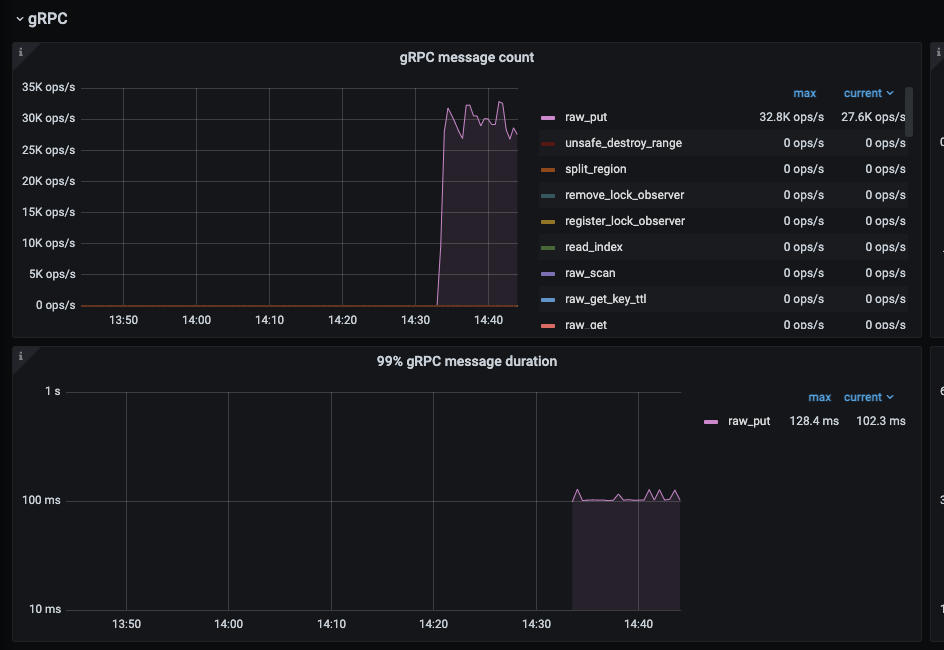
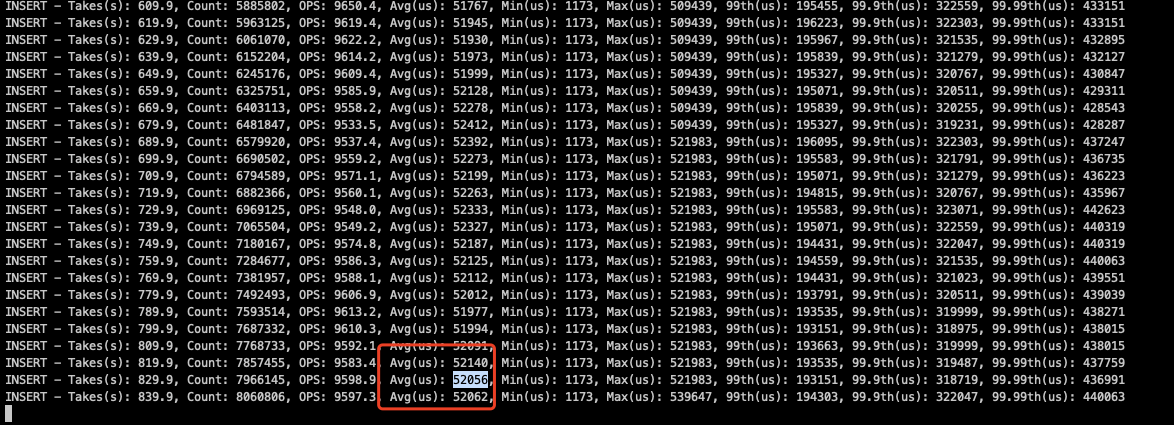
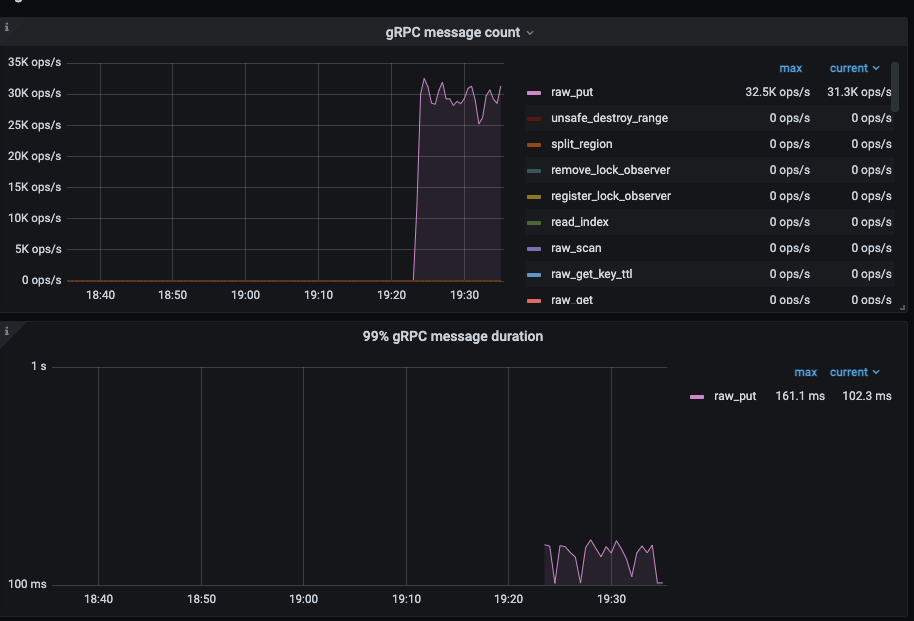
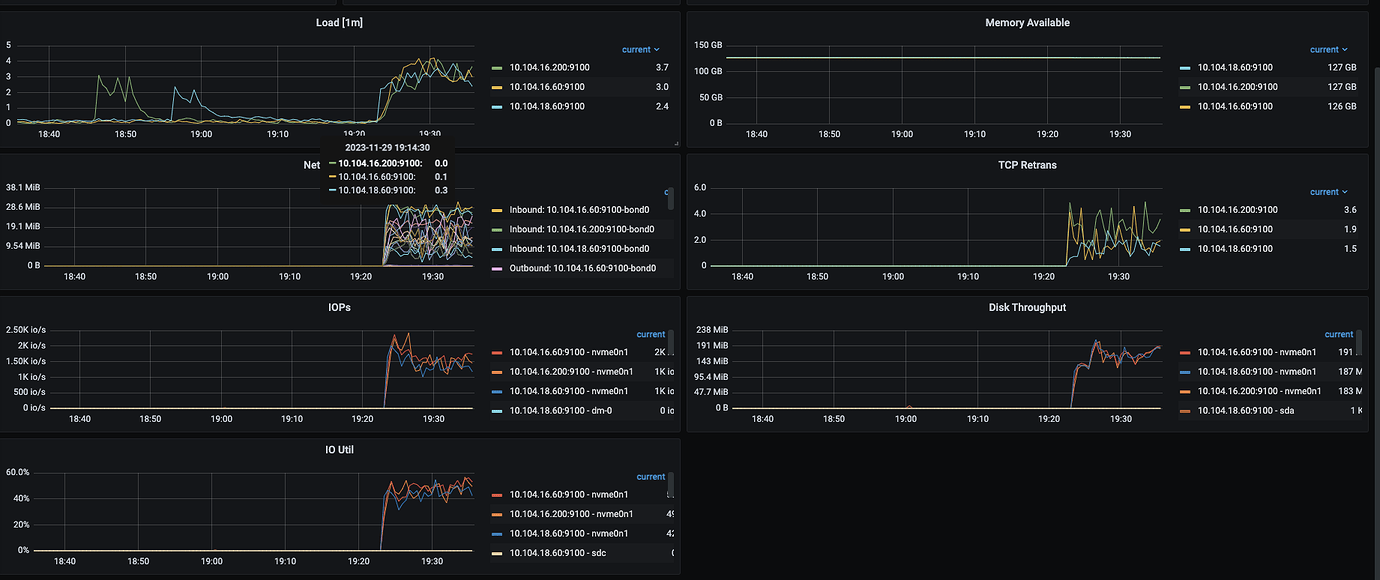
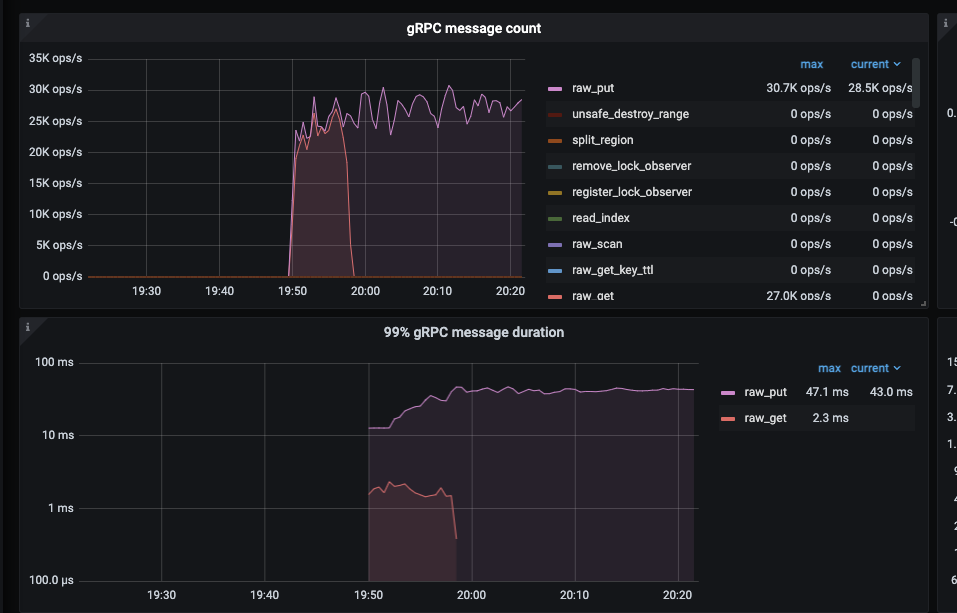
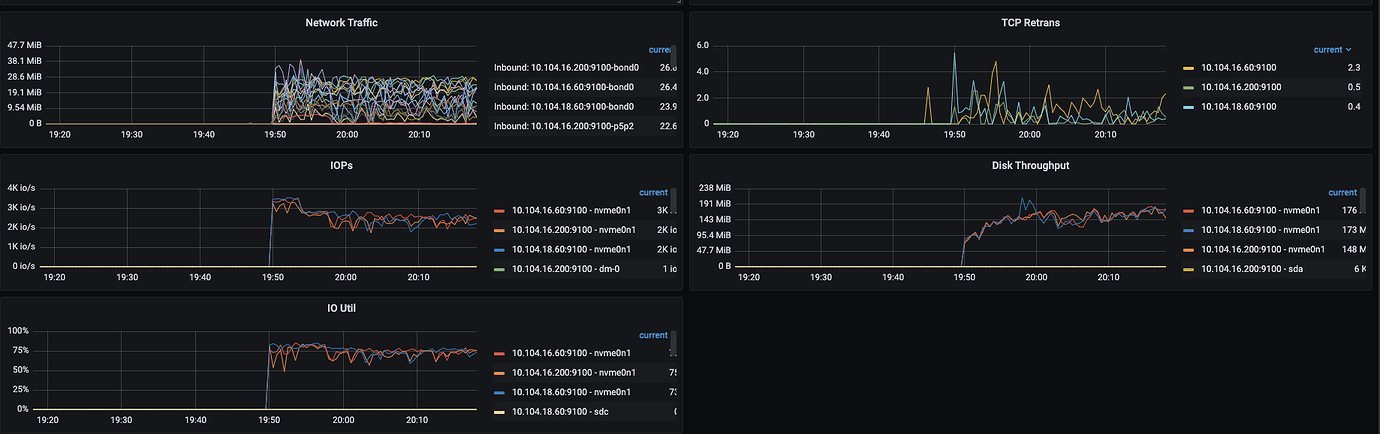
Using three high-configuration machines, each executing the following YCSB benchmark command twice (total benchmark concurrency = 6432=384), regardless of the concurrency level, TiKV write QPS=28.5K ops/s, with single disk IOPS only around 3k, unable to push the disk IOPS higher.
tiup bench ycsb run tikv -p tikv.pd="http://10.104.16.60:2379,http://10.104.16.200:2379,http://10.104.18.60:2379" -p tikv.type="raw" -p recordcount=10000000 -p operationcount=30000000 -p insertproportion=1 --threads 64
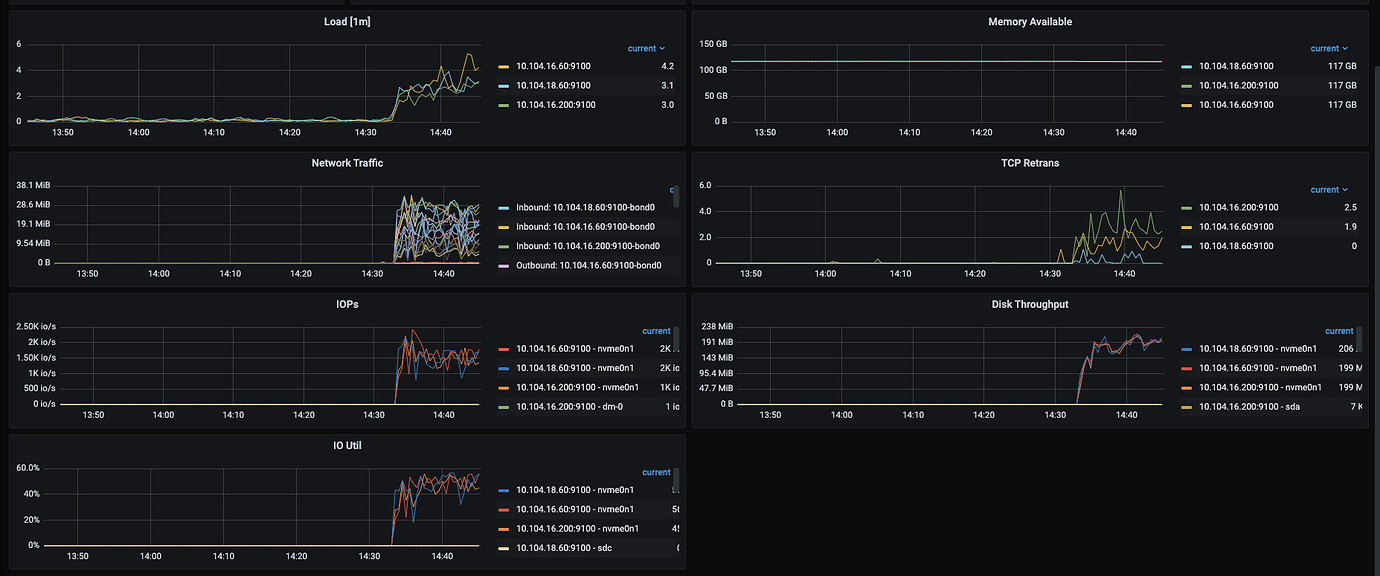
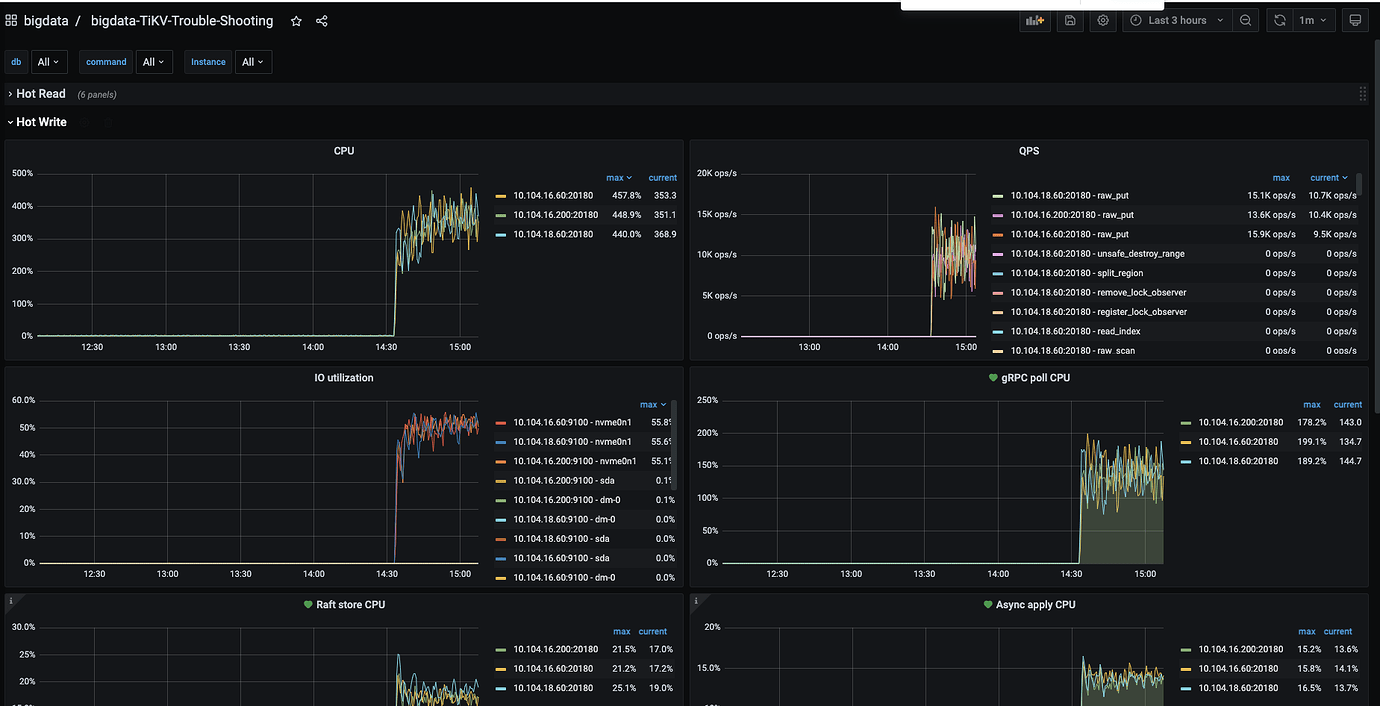
At the same time, system CPU, memory, and IO resources are idle, and system resources cannot reach the bottleneck.
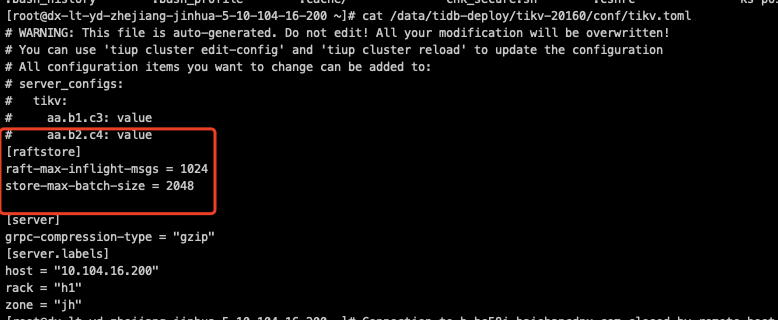
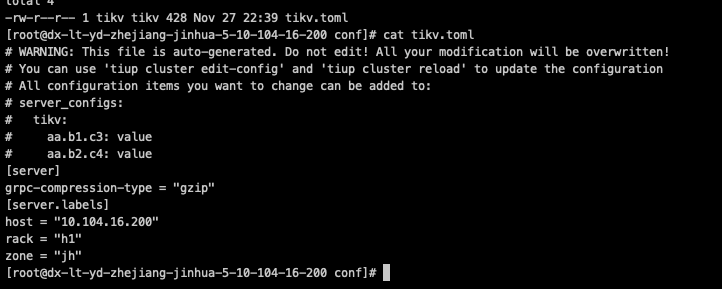
I have referred to cluster optimization and tuning, but it has not been effective. TiKV configuration parameters are mostly system defaults, and increasing the thread count previously had no effect.
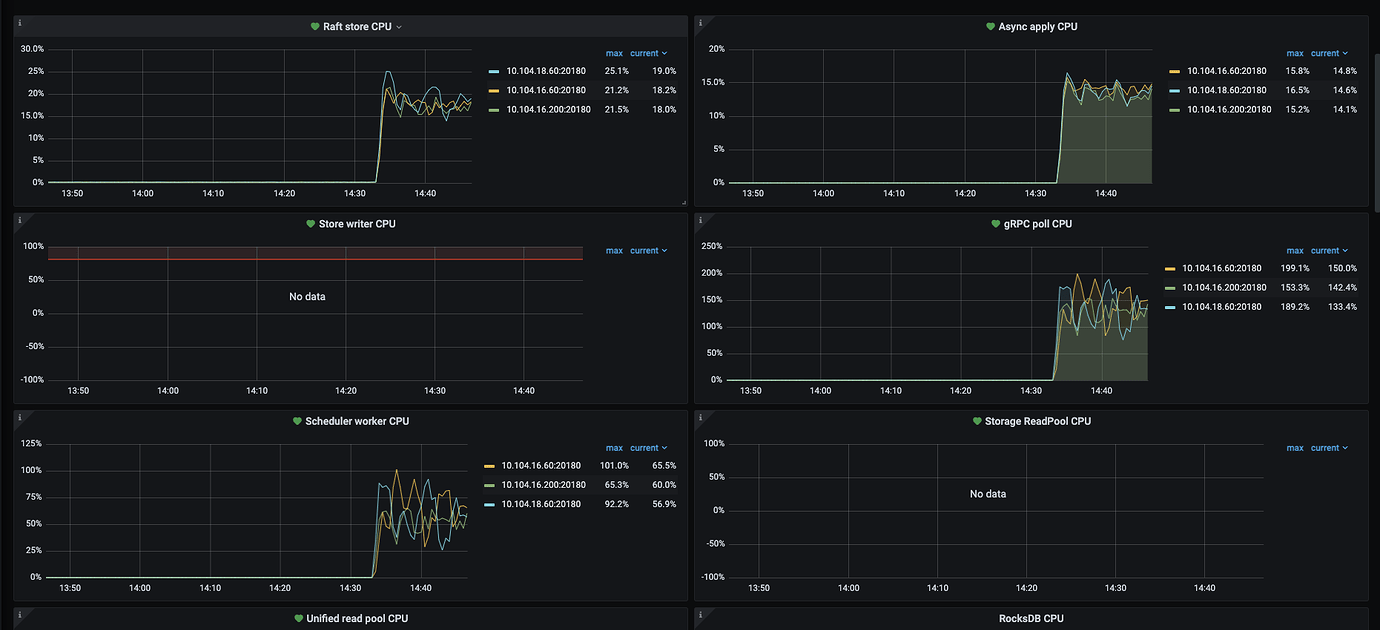
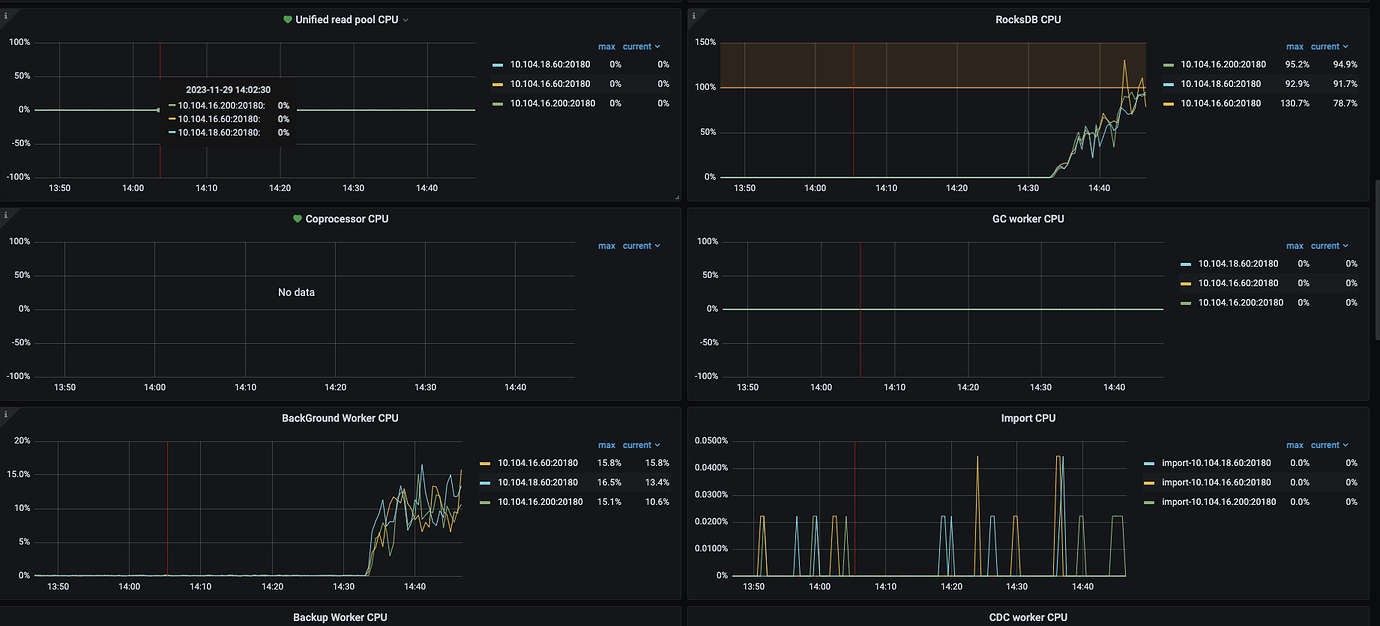
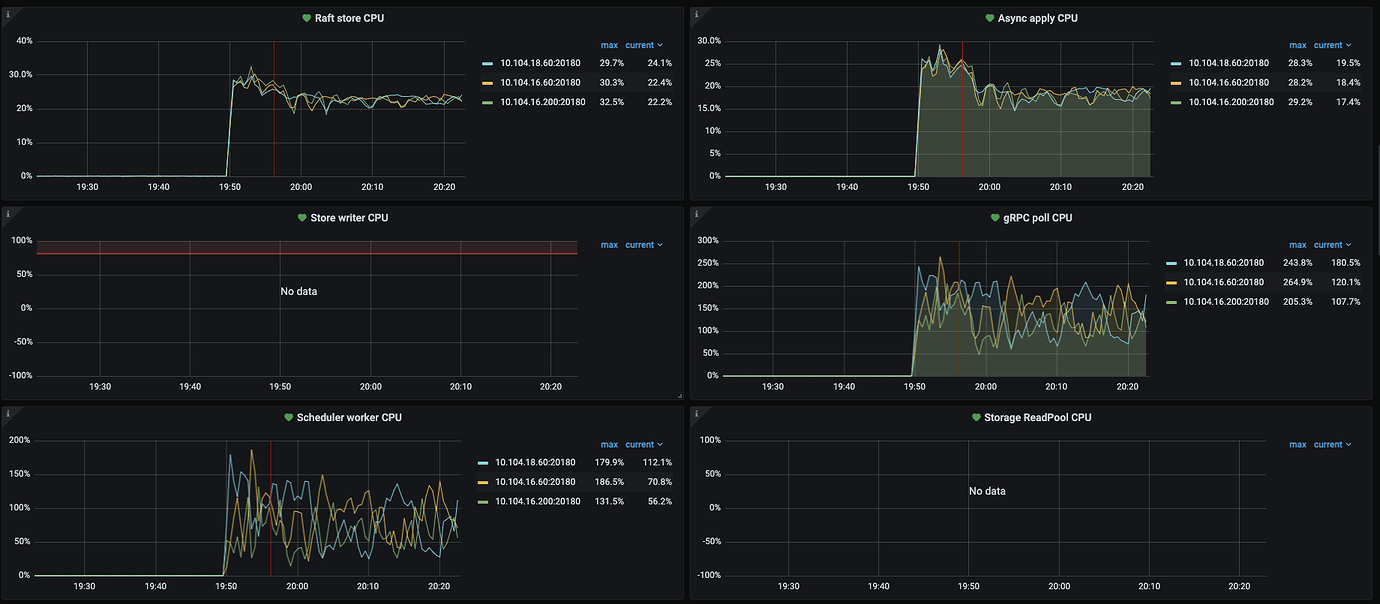
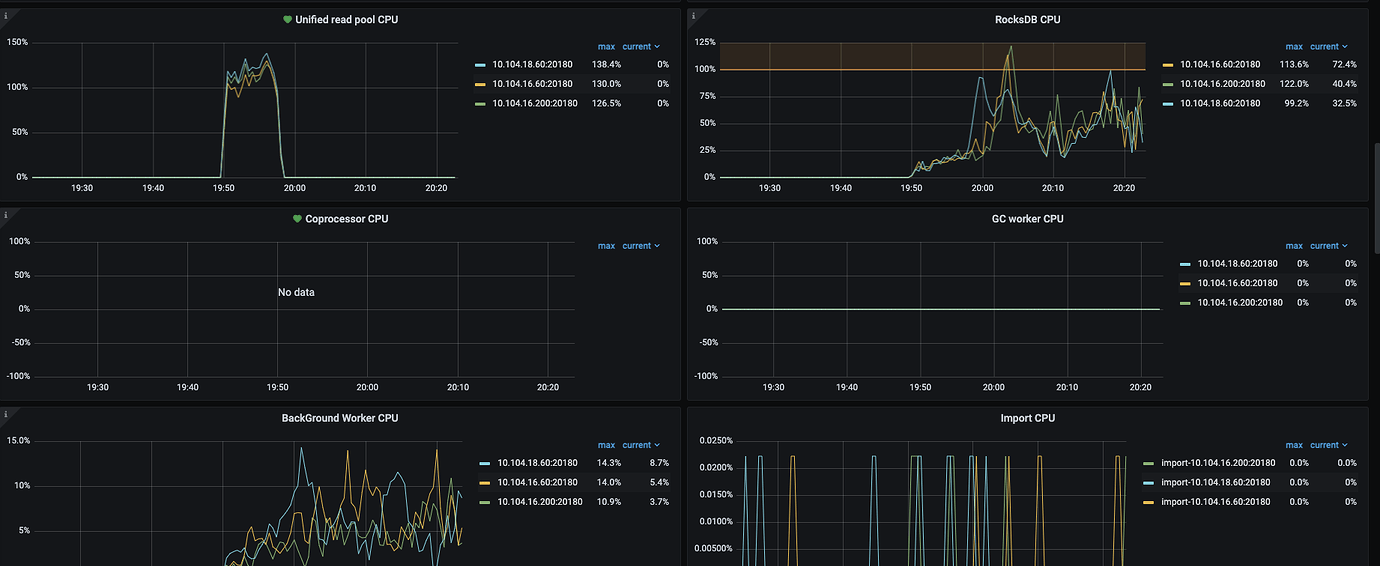
Thread CPU monitoring data.
Seeking help, what is causing the write concurrency to not increase, and how can it be resolved??