Hey TiDB folks,
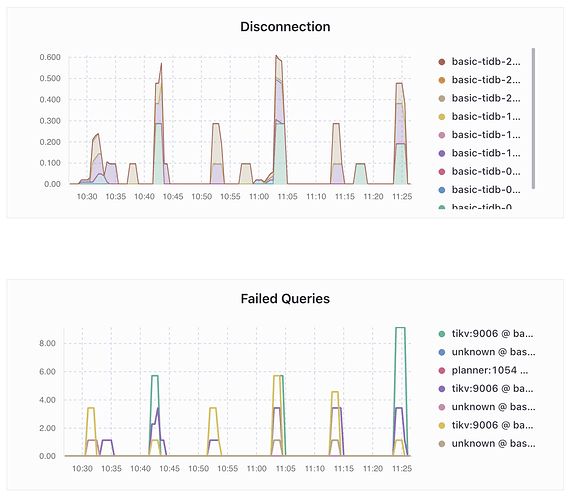
I hoping you can help with a puzzling problem: every ~10 minutes my in-flight stale reads fail.
Here’s a dashboard graph illustrating it (focus on “Failed Queries”):
The clients get messages like this from TiDB when the queries fail:
Query Error: error returned from database: 9006 (HY000): GC life time is shorter than transaction duration, transaction starts at 2023-04-07 13:27:42.135 +0000 UTC, GC safe point is 2023-04-07 13:28:22.687 +0000 UTC
Interestingly, this only happens for these two queries, which are both stale reads.
Here’s the first one:
SELECT
  `pkh`
FROM
  `allocated_account` AS of timestamp `tidb_bounded_staleness` (NOW () - INTERVAL ? SECOND, NOW ())
WHERE
  `pkh4` IN (...)
Here’s the second:
SELECT
  `sk`
FROM
  `sk` AS of timestamp `tidb_bounded_staleness` (NOW () - INTERVAL ? SECOND, NOW ())
WHERE
  `pkh4` IN (...)
Details:
- I’m using 300 seconds as my max staleness and the GC time is set at the default (10 minutes). The
...in the clauseWHERE pkh4 in (...)is around 1K elements, each of size 4 bytes. - I have configured TiDB to send reads only to local followers as is detailed in this thread.
- I believe my client maintains at most 8 in-flight queries at any given point, and they all appear to be processed promptly.
Do you have any idea what might be happening?
It seems like it is clearly related to the GC timeout, but I haven’t observed any client-side slowdown consistent with super-slow queries exceeding 10 minutes.
I’m attaching the TiDB Dashboard Diagnosis Report to provide more details.
Thanks!
TiDB Dashboard Diagnosis Report.html (619.6 KB)
